
Figure 3.
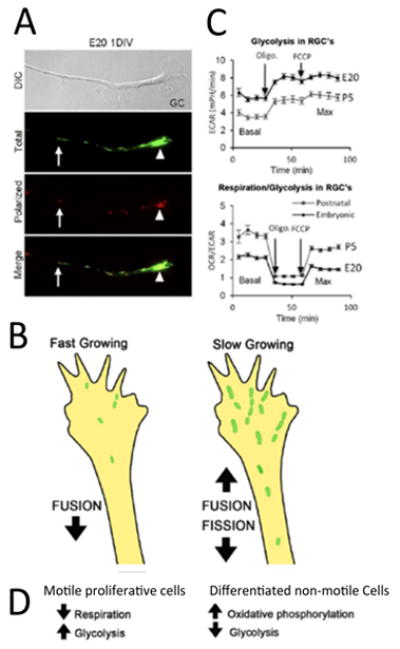
In nascent RGC axons, mitochondrial organization and bioenergetics correlate with axon growth rate. A. DIC image of a distal RGC axon and growth cone. JC-1 monomer emission at 530 nm (green) reveals total mitochondria and JC-1 J-aggregate emission at 590 nm (red) reveals the high potential, polarized, regions within mitochondria, demonstrating heterogeneity within the mitochondrial network. Mitochondria are detected as individuals (arrows) and as complexes (arrowheads) that differ in their degree of polarization. B. Glycolysis is higher in fast growing embryonic RGCs whereas the basal and maximal OCR (oxygen consumption rate)/ECAR (extracellular acidification rate) ratios are greater in P5 RGCs, indicating a greater reliance on oxidative phosphorylation in slow growing RGC axons [43]. C. Schematic showing that fast growing RGCs are associated with small active mitochondria in the growth cone compared to slower growing postnatal RGC axons, which harbor more, longer mitochondria likely due to differences in mitochondrial fission and fusion dynamics. D. Data from RGCs agree with data from motile, proliferative cells, which rely more on glycolysis, whereas differentiated, non-motile cells, rely primarily on oxidative phosphorylation.