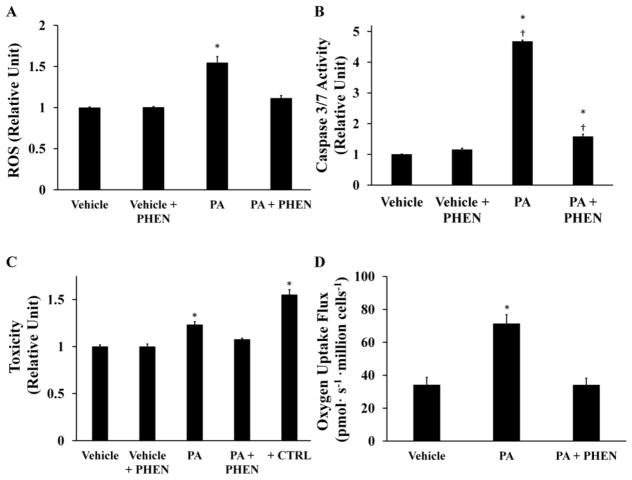
Figure 4. Phenformin abolishes palmitate-induced ROS generation, mitochondrial activation, and apoptosis.
H4IIEC3 cells were co-treated with 100 μM phenformin (PHEN) and either 400 μM palmitate (PA) or 800 μM BSA (Vehicle) to examine the role of mitochondrial metabolism in ROS accumulation and apoptosis. (A) ROS levels at 6 hours as measured by DCF fluorescence. (B) Caspase 3/7 activity at 12 hours. (C) Cell toxicity at 24 hours assessed by PI fluorescence. Positive control cells (+CTRL) were treated with 70% ethanol for 30 minutes. (D) Oxygen uptake measurements of PHEN- and/or PA-treated cells. Data represent mean +/− S.E., n=4 for all fluorescent assays, n=3 for oxygen uptake measurements; * different from vehicle, p <.05; † different from each other, p <.05.

