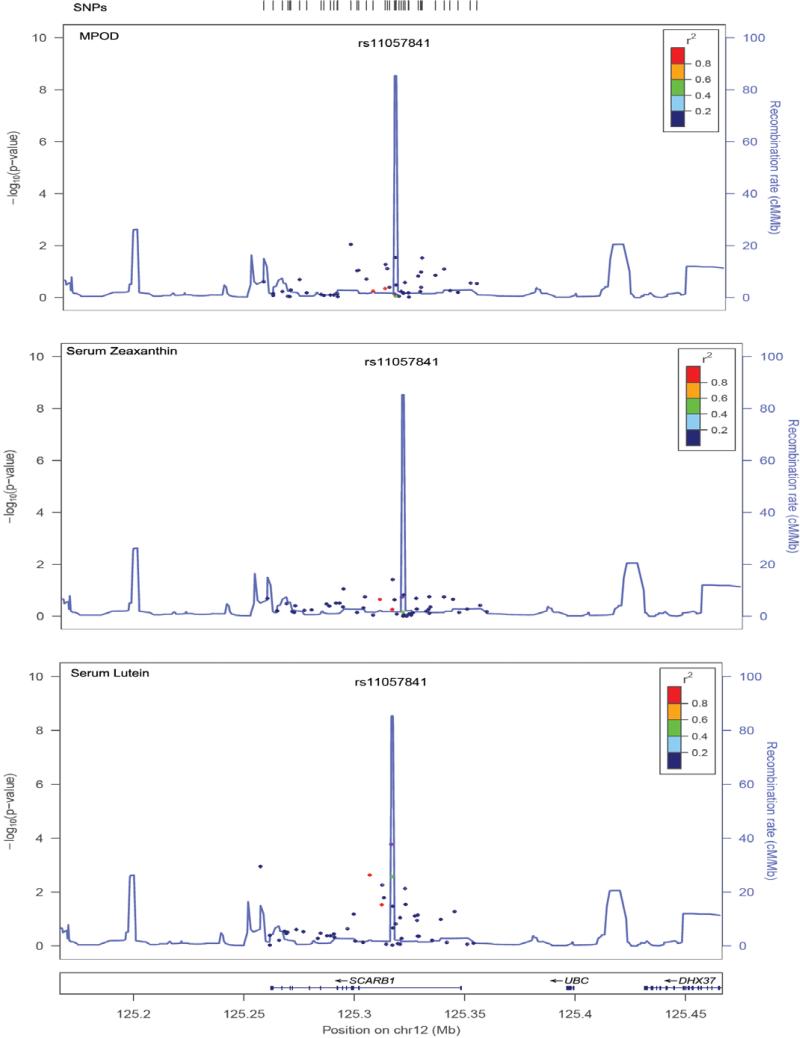
Figure 2.
Regional association plots for SNPs investigated. Panels represent signals for the outcome measures (1) macular pigment optical density (MPOD), (2) serum zeaxanthin levels (serum Z) and (3) serum lutein levels (serum L). The color of the SNP symbol indicates the linkage disequiliblium (r2) with the index SNP, which is colored purple (http://csg.sph.umich.edu/locuszoom/). Points on the plot relate to the p-values (indicated on the left side scale) and the lines relate to the recombination rates (right side scale).

