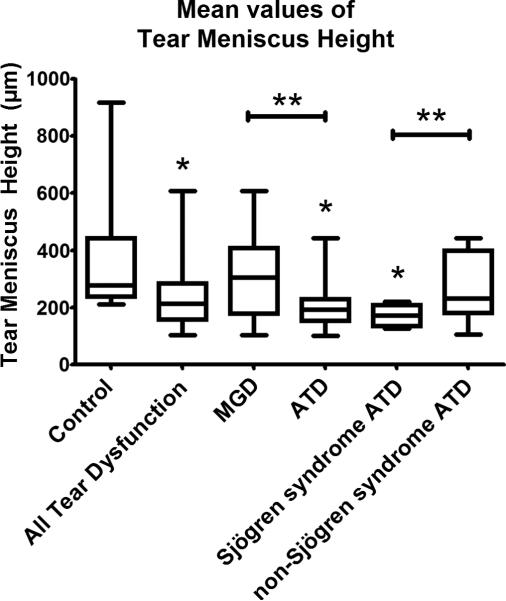
Figure 2.
Mean values of tear meniscus height for each group. *Denotes significance compared to normal (p ≤ 0.05). **Denotes significance between groups indicated (p value ≤ 0.05). Groups include control (345 μm), all tear dysfunction (234 μm), meibomian gland disease (MGD) (302 μm), aqueous tear deficiency (ATD) (210 μm), Sjögren syndrome (171 μm), and non-Sjögren syndrome ATD (262 μm). Significant comparisons include all tear dysfunction vs. control (p = 0.0057); ATD vs. control (p = 0.0016); Sjögren syndrome ATD vs. control (p = 0.0054); and MGD vs. ATD (p = 0.0235); and Sjögren syndrome ATD vs. non-Sjögren syndrome ATD (p = 0.0358). Thick error bars indicate the 25% percentile and 75% percentile. Thin error bars indicate minimum and maximum values. Confidence intervals for each group are listed in the Results section.

