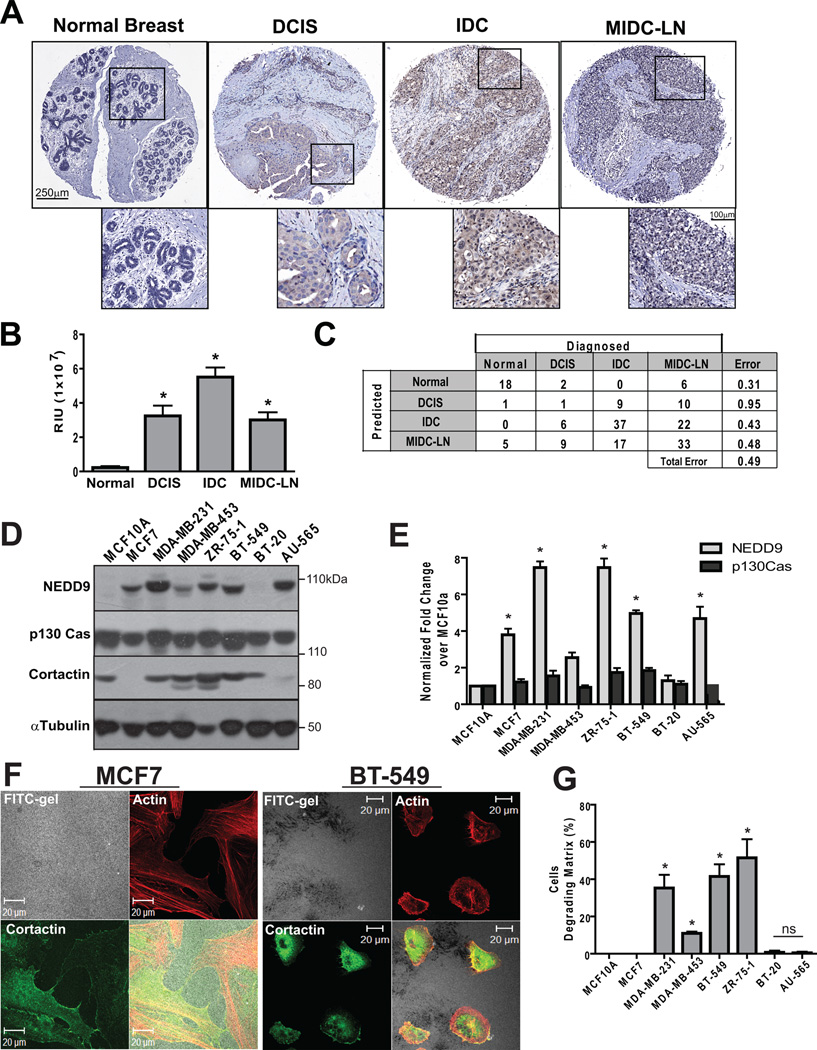
Figure 1. NEDD9 is overexpressed in invasive breast ductal carcinomas and BCa cell lines.
(A). Representative images of IHC staining with anti-NEDD9 antibodies in normal breast, DCIS, IDC MIDC-LN. (B). Statistical analysis of NEDD9 expression based on intensity of staining in (A), mean values +/− S.E.M, one-way ANOVA*, p<0.001 (Normal/IDC, Normal/MIDC-LN, Normal/DCIS), p<0.05 (DCIS/IDC, IDC/MIDC-LN), ns-non significant (DCIS/MIDC-LN) (C). The data (B) were analyzed by Random forest statistical software to assess the predictive value of NEDD9 expression. (D). Western Blot analysis (WB) of NEDD9, p130Cas, cortactin and tubulin in the indicated cell lines. (E). Quantification of NEDD9 and p130Cas as in (D), normalized to MCF10A, * p<0.001. (F). Immunofluorescent (IF) staining of MCF7 and BT-549 cells with Rhodamine-Phalloidin (red) and cortactin (green), FITC-gelatin (white). (G). Quantification of matrix degradation, 100 cells/cell line n=3, % of cells degrading matrix, +/− S.E.M, * p<0.0001 one-way ANOVA.

