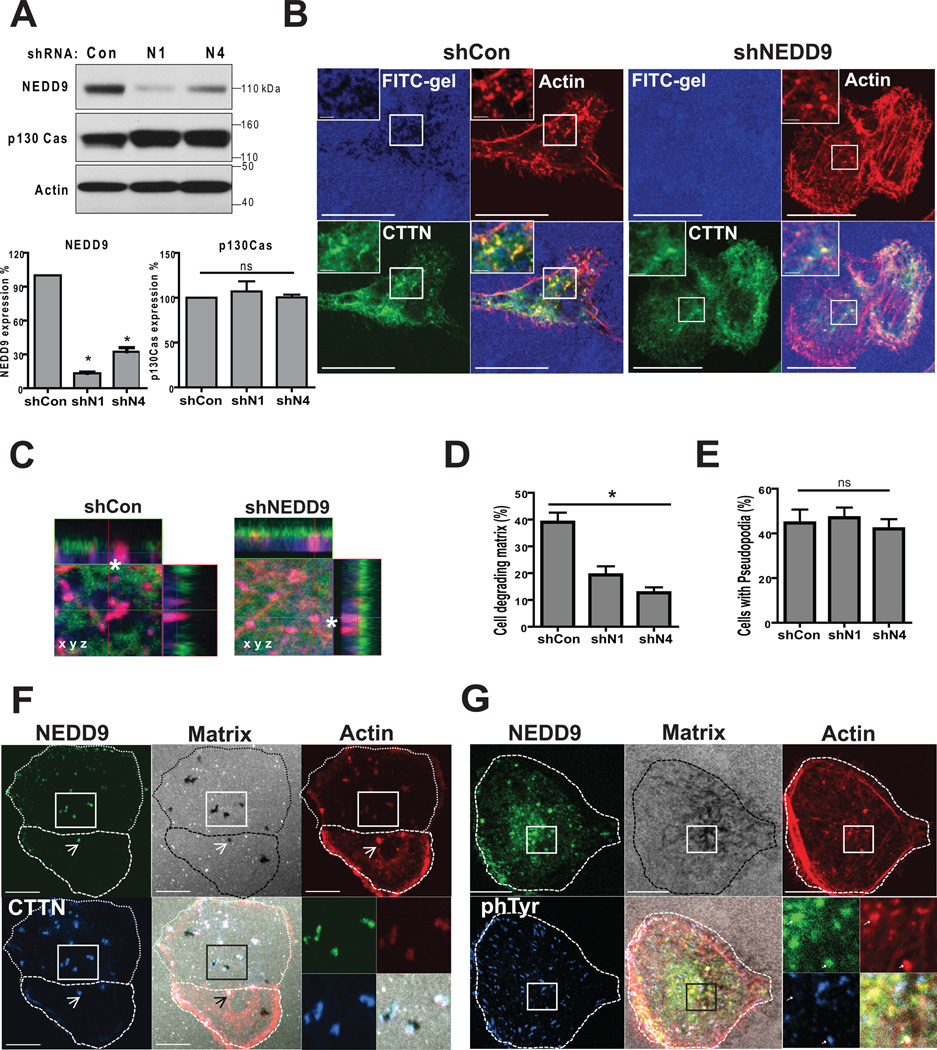
Figure 2. NEDD9 localizes to and promotes invadopodia maturation.
(A). Top: WB of NEDD9, p130Cas, actin in MDA-MB-231-shNEDD9 or -shCon cells, Bottom: quantification of NEDD9 and p130Cas expression normalized to shCon; one-way ANOVA, p<0.001. (B). IF staining of MDA-MB-231-shCon and -shNEDD9 cells with anti-cortactin (green), -actin (red) antibodies and FITC-gelatin (blue), scale bar 10µm. Inserts are enlarged areas indicated in the main panel. (C). Enlarged XYZ projections of IF as in (B). (D). Quantification of number of cells degrading matrix and F-actin/cortactin positive foci (E) in MDA-MB-231-shCon, -shNEDD9 (N1, N4) cells. Student’s t-test for (D): *p<0.001(shCon/shN1, shCon/shN4), ns -shN1/N4; and ns (E) +/− S.E.M. (F). IF of MDA-MB-231 cells with cortactin (blue), actin (red) and NEDD9 (green), and FITC-gelatin (white). (G). IF staining with anti-phTyr (blue), actin (red) and NEDD9 (green) antibodies, and FITC-gelatin (white). Scale bar −10 µm. Inserts are enlarged areas indicated in the main panel.

