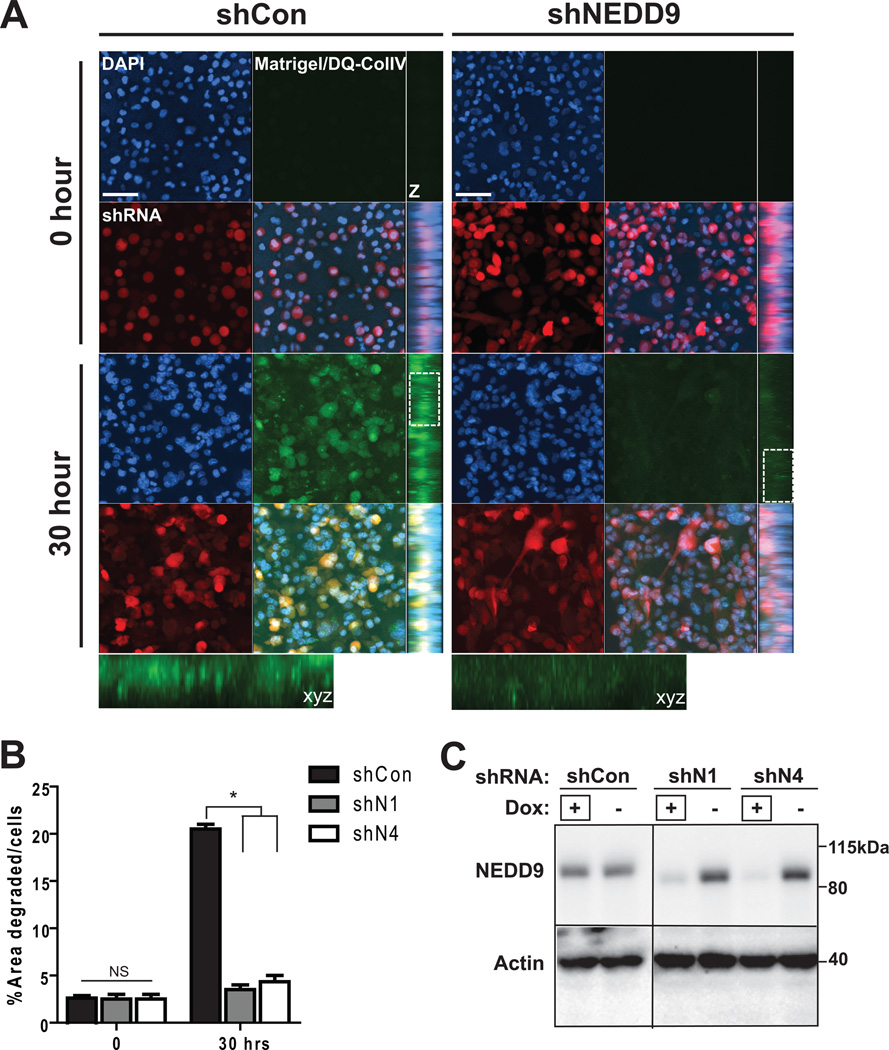
Figure 3. NEDD9 depletion ablates matrix degradation and invasion in 3D matrices.
(A). Representative images of 3D projections live cell imaging of MDA-MB-231-shCon, -shNEDD9 cells embedded in the DQ-CollagenI/IV/matrigel matrix, shRNA (red), DNA (blue) at indicated time points; xyz projections (z), scale bar −50µm. Insets are enlarged areas indicated in white rectangle. (B). Quantification of FITC-fluorescence intensity as in (A), % of area degraded per cell, +/− S.E.M, *p<0.0001 one-way ANOVA. (C). WB of cells in (A–B) with anti-NEDD9 and actin antibodies. +Dox indicates the lines used in A–B.

