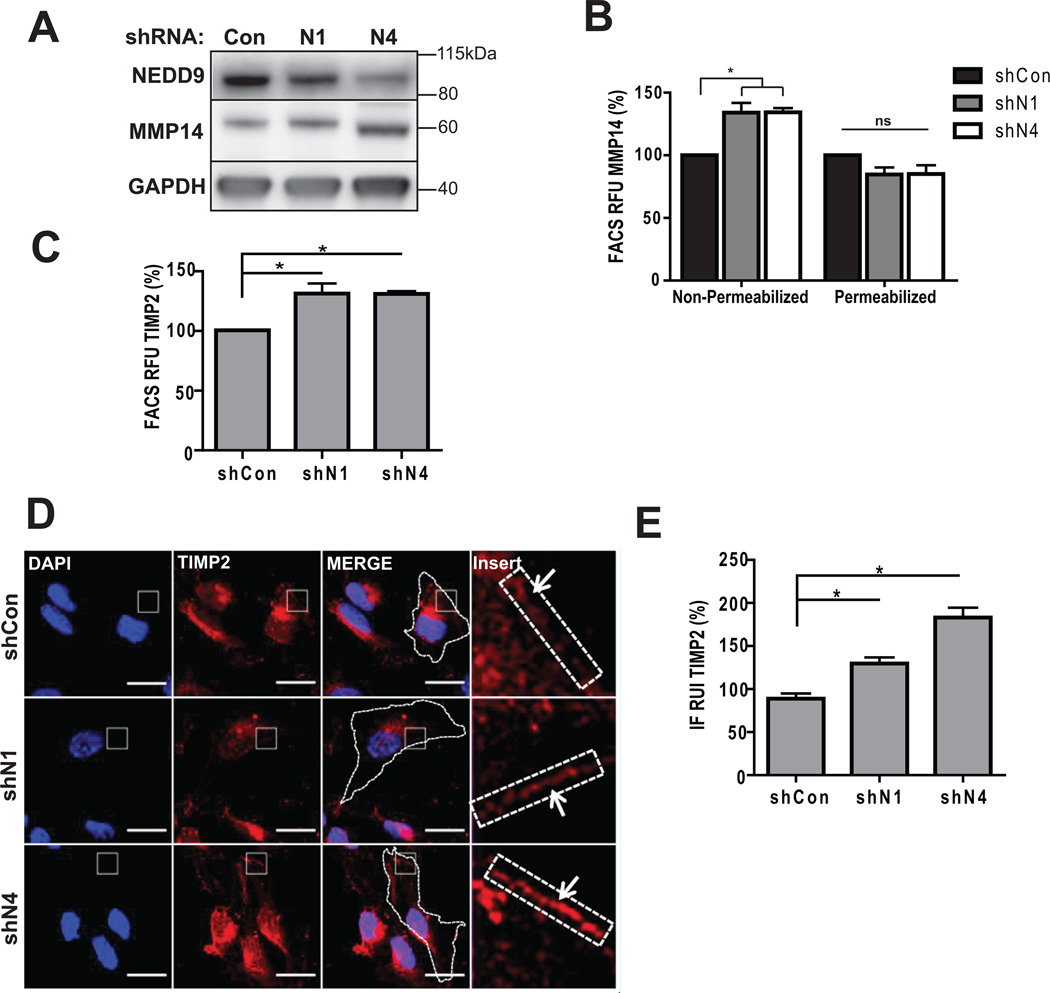
Figure 5. NEDD9 depletion leads to increase in amount of surface-bound TIMP2 and MMP14.
(A). WB of WCL with anti-NEDD9, -MMP14, -GAPDH antibodies. (B). FACS of MMP14: surface (non-permeabilized) and total (permeabilized) normalized to shCon; one-way ANOVA *p<0.005 (shCon/N1 or /N4) -surface cells, ns, -total. (C). FACS of TIMP2-surface, normalized to shCon; t-test *p=0.039 (shCon/N1), *p=0.0029 (shCon/N4). (D). Representative images of IF, MDA-MB-231-shCon, -shNEDD9 cells with anti-TIMP2 antibody (red), DNA (blue). Scale bar, 20µm. Inserts are ×100 magnified areas identified on the image. (E). Quantification of TIMP2 fluorescence intensity at the membrane as in (D) normalized to shCon; t-test *p<0.001 (shCon/shN1 or /N4), ns - shN1/shN4.

