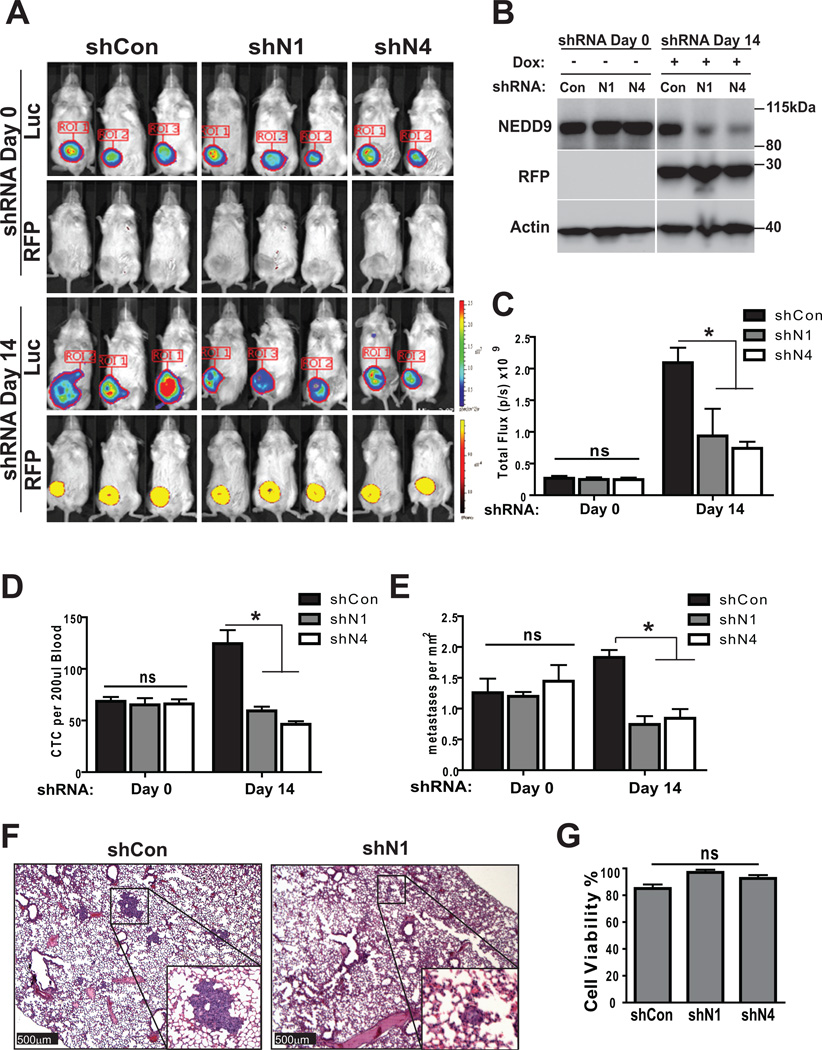
Figure 7. NEDD9 depletion inhibits metastasis in xenograft models.
(A). Representative images of bioluminescence and RFP fluorescence of mice orthotopically injected with MDA-MB-231LN-shCon or –shNEDD9 cells. shRNA-Day0–3 weeks post injection, regular chow; shRNA-Day14–2 weeks doxycycline chow; 6 mice/shRNA/3 independent experiments. (B). WB of primary tumor tissue at (shRNA-Day0, -Day14) with anti-NEDD9, -RFP and -actin antibodies. (C). Quantification of tumor growth based on bioluminescence in 3 independent experiments, n=6/group, mean photon flux, +/− S.E.M, one-way ANOVA, p is ns for shRNA-Day0 (shCon/shN1 or /N4), shRNA-Day14 (shCon/shN1, shN1/shN4); *p=0.032 for shRNA-Day14-shCon/shN4. (D). Quantification of RFP/luc2/DNA positive tumor cells in peripheral blood of shCon and shNEDD9 mice at indicated times, n=6/group/3 independent experiments; plotted as mean number of cells per 200µl of blood, +/− S.E.M, two-way ANOVA, ns (shRNA-Day0: shCon/shN1 or /N4); p<0.001 (shRNA-Day14: shCon/shN1 or /N4). (E). Quantification of metastases in lungs of orthotopically injected animals at indicated times by pathologist using serial sections of lungs and H&E staining, plotted as mean number of metastases per mm2 +/− S.E.M, n=6/group/3 independent experiments; two-way ANOVA p -ns (shRNA-Day0: shCon/shN1 or /N4); p<0.001 (shRNA-Day14: shCon/shN1 or /N4). (F). Representative images of H&E staining as in (E). Scale bar-500µm, main panel, 50µm -insert. (G). Quantification of number of trypan blue negative vs. positive shCon or shNEDD9 cells, 72 in suspension. One-way ANOVA, p=0.0946.

