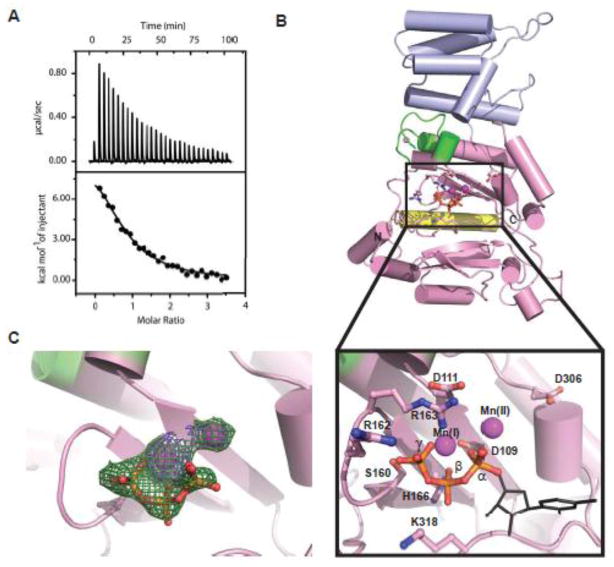
Fig. 3.
Binding of UTP and Mn2+ by p48. (A) ITC isotherm showing the raw (upper) and integrated (lower) heat changes for UTP binding to p48 (30 μM) in the presence of Mn2+ (100 μM). (B) Crystal structure of p48ΔL•UTP•Mn2+ colored by subdomain as in Figure 1, and including metals, UTP and key conserved residues. The insert shows an expansion of the active site region. The triphosphate moiety of UTP is shown in ball and stick representation. The manually positioned sugar and base moieties of UTP are shown as black lines. (C) Simulated annealing (mFo-DFc) omit electron density map contoured at 3σ (green) and 5σ (purple) showing both metals and the triphosphate of UTP.

