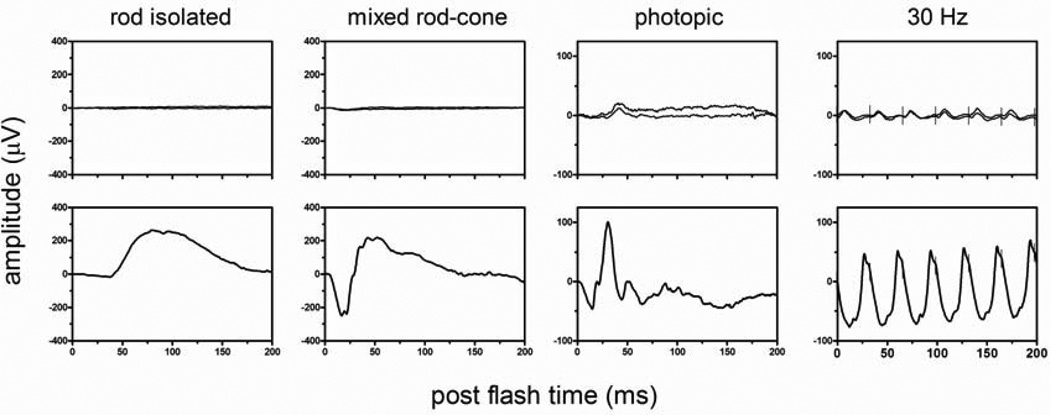
Figure 5.
Full-field ERG responses – the top row is from a patient with confirmed autoimmune retinopathy and the bottom row represents a healthy control. Rod responses are absent from the patient. Photopic and 30 Hz tests reveal cone responses that are extremely reduced and delayed. (Courtesy of Brett Jeffrey, PhD)

