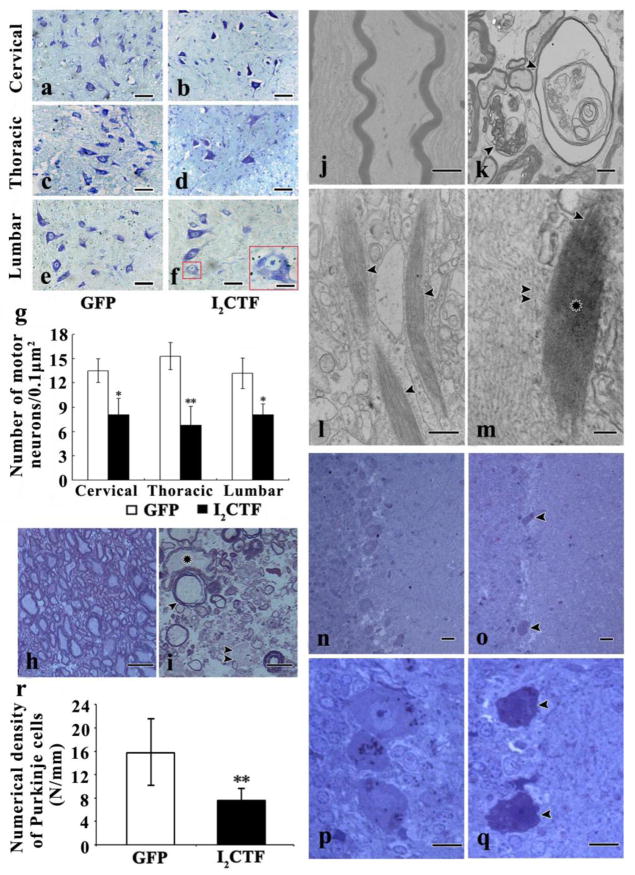
Fig. 4. I2CTF expression induces degeneration and loss of motor neurons, and degeneration and demyelination of axons, proliferation of neurofilaments, accumulation of tight fibrous bundles in the neuronal soma and axons at all levels of the spinal cord, and loss of Purkinje cells in the cerebellum.
a–g: Nissl staining showed condensation (a–f), spongiosis (f) and loss (g) of motor neurons in the spinal cords of I2CTF rats. h (GFP rats), i (I2CTF rats): Toluidine blue-stained sections of the epon-embedded spinal cord showed a severe degeneration (i, asterisk), demyelination (i, arrowhead), and residues of degraded axons (i, double arrowheads) in I2CTF rats; j–m: Electron microscopy showed normal axons in GFP rats (j), and degenerated and demyelinated axons (k, arrowheads),inclusions of compact fibrous bundles in neuronal processes (l, arrowhead), 20–35 nm thick filaments in compact fibrous bundles (m, arrowhead) compared to ~10 nm neurofilaments (double arrowheads) and loss of morphology of fibers in the central portion of inclusions (m, asterisk). n–q: Toluidine blue-stained sections of the epon-embedded tissue showed an extensive cerebellar degeneration associated with cytoplasmic condensation and loss of Purkinje cells (o, q, arrowhead) in the I2CTF rats. n, p: GFP rats. r: quantitation of the numerical density of Purkinje cells from cresyl violet stained paraffin sections of cerebellar cortices from I2CTF and GFP rats. a–r: Data from 14-month-old rats. g, r: The data are presented as mean±SD. Scale bar: a–f: 50 μm; f: bar in inset: 10 μm; g, h: 15 nm; m, n: 50 nm; o, p: 25 nm; i, j: 2 μm; k: 500 nm; l: 100 nm.

