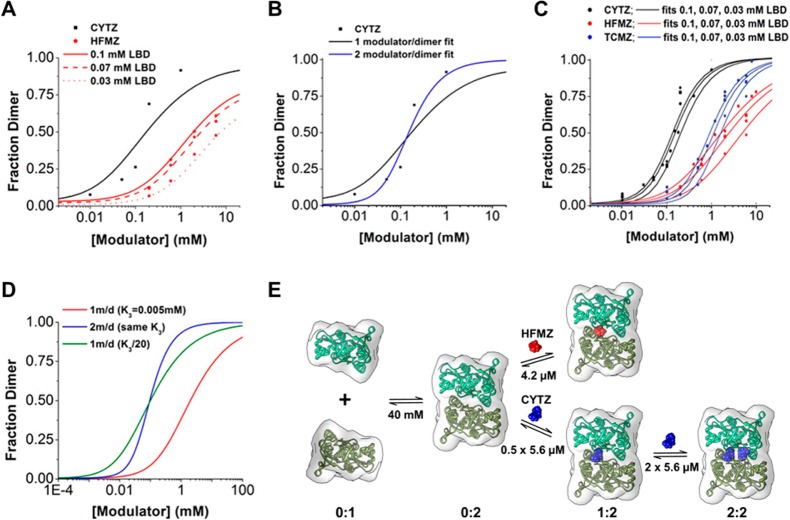
Figure 4.
SAXS data and curve fitting for equilibrium dimerization models. (A) Fraction of dimer in the presence of CYTZ and HFMZ fit to the 1 monomer/dimer binding model. (B) Comparison between 1 and 2 monomer/dimer binding model fits for CYTZ-dependent dimerization. (C) The fraction of LBD dimer for CYTZ, HFMZ, and TCMZ at various protein concentrations were determined using SAXS and were fit simultaneously using equations derived from equilibrium dimerization models and the dissociation constants listed in (E) and (TCMZ, K3 = 46.8 μM). (D) Hypothetical curves based on 1 modulator/dimer binding and 2 modulator/dimer binding with identical modulator EC50 values illustrate the shift in the EC50 of dimerization as well as the difference in apparent cooperativity. The 1 modulator/dimer binding model requires a 20-fold increase in modulator affinity to the dimer to achieve a similar EC50 as the 2 modulator/dimer binding model. (E) The modeled pathway for HFMZ-dependent dimerization and CYTZ-dependent dimerization is summarized.

