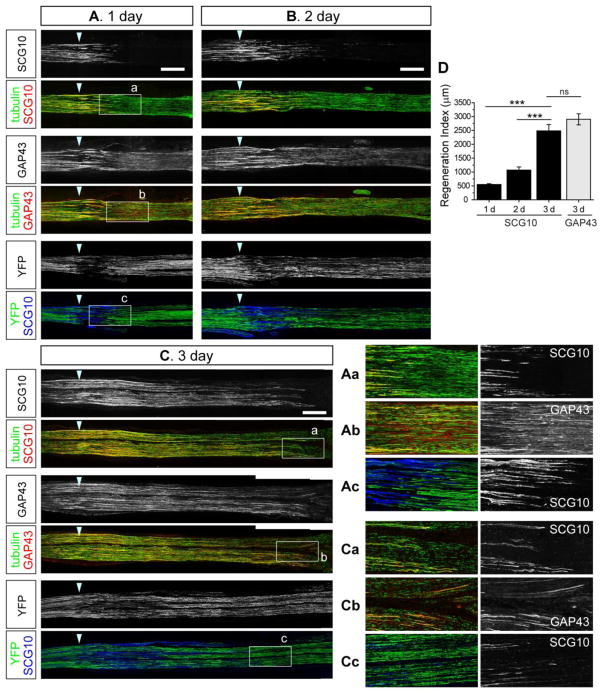
Figure 4. SCG10 selectively labels regenerating axons and displays higher specificity than GAP43 or YFP in the early stage of axon regeneration after nerve crush.
(A), (B) and (C) Confocal images of longitudinal sciatic nerve sections at 1, 2 and 3 d after crush lesion. Cryosections obtained from the same nerves are immunostained for SCG10 and GAP43 at each time point. Co-staining for the neuron-specific β3 tubulin visualizes microtubules in axons. The YFP expression pattern is examined in the YFP 16 transgenic mice. At day 1 (A), SCG10 expression is specific to regenerating axons whereas GAP43 and YFP also labels distal axons that will eventually degenerate. Boxed regions are magnified in (Aa), (Ab) and (Ac). At day 3 shown in (C), SCG10 and GAP43 selectively label regenerating axons but YFP still labels degenerating particles robustly. Boxed regions are magnified in (Ca), (Cb) and (Cc). Arrowhead indicates the crush site. Scale bar = 500 μm.
(D) Axon regeneration during 1, 2 and 3 d after crush is quantified by a regeneration index that is the distance from the crush to the location at which the level of SCG10 is half of that at the crush site. Regeneration at day 3 is also quantified with the same method using the level of GAP43. n = 4 for 1 d, 7 for 2 d, 4 for 3 d with SCG10 staining, n = 3 for 3 d with GAP43 staining; ***p < 0.001 by ANOVA. Error bars represent SEM.

