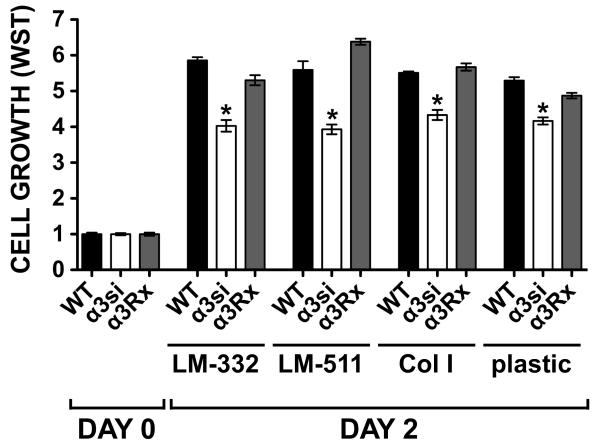
Figure 6. Impaired proliferation of α3-silenced 4T1 cells.
Wild type, α3-silenced, and α3Rx 4T1 cells were plated in 2% FBS in wells coated with 1 μg/ml LM-332, 1 μg/ml LM-511, 10 μg/ml collagen I, or in uncoated wells. One set of wells was assayed by WST-1 on day 0 (the day of plating) to measure cells input, and the remaining wells were assayed on day 2. Bars represent mean ± SEM for 6 wells per cell type per condition, normalized to day 0 values. The growth of the α3si cells was significantly less than that of either the wild type or α3Rx cells on all substrates tested (*P<0.001, ANOVA with Tukey post-test).

