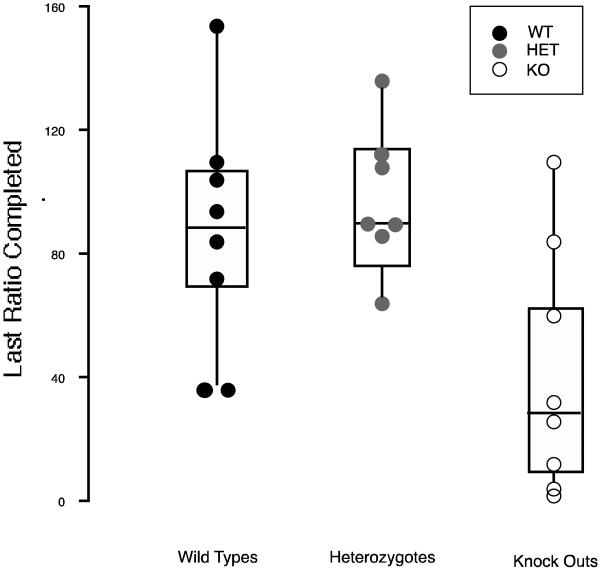
Figure 2.
Box plots of the last ratio completed by WT (solid circles), HET (gray filled circles) and SERT KO mice (open circles) when responding for 12% (w/v) ethanol under a progressive ratio schedule. Values plotted are means for each mouse for the five sessions in which the stability criteria were initially met. Boxes around points represent the mid-fifty percent values.

