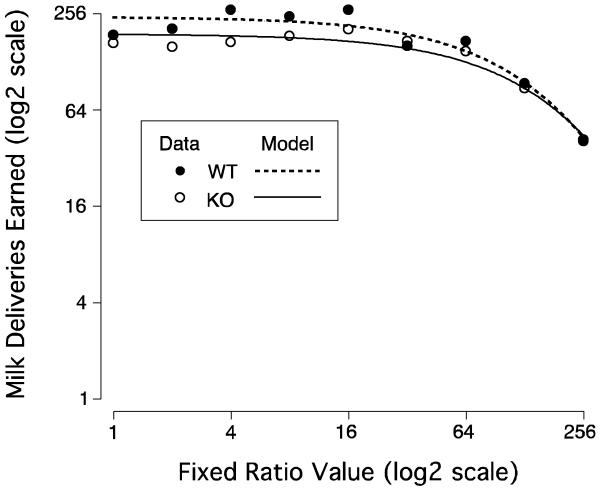
Figure 4.
Mean number of 50% condensed milk dipper presentations earned at each fixed-ratio value during the last five sessions at this value are plotted against the value of the fixed-ratio (both on a log2 scale). The mean data are represented by the circles (WT - solid; KO - open) and the fitted behavioral economic model log(Q)=log(Q0) + k(e−αP − 1) is represented by the lines (WT - short dash; KO – solid).

