
Figure 6.
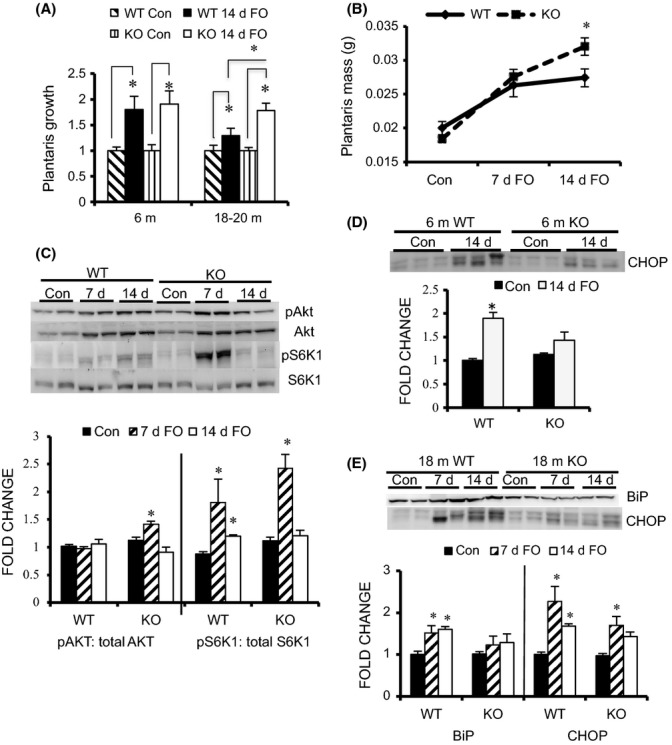
Load-induced growth is maintained in older MuRF1 KO mice compared with WT mice. (A) Growth of the plantaris muscle (fold change relative to control, mean ± SEM, n = 5) following 14 days of functional overload (FO) in young (6 m) and older (18–20 m) WT (black) and MuRF1 KO (white) mice. (B) Growth of the plantaris muscle (wet weight in grams) following 7 and 14 days of FO in 18- to 20-month-old WT (solid) and MuRF1 KO (dashed) mice. (C) Representative Western blots (n = 2) and quantification (n = 4) of the phosphorylation levels of Akt and S6K1 in the plantaris muscle of old (18–20 m) WT and KO mice following no treatment (Con, black) and FO for 7 (hatched) and 14 (white) days. (D) Representative Western blot (n = 3) and quantification (n = 5) of CHOP protein levels in the plantaris of young WT and MuRF1 KO mice following no treatment (Con, black) and 14 days of FO (white). (E) Representative Western blot (n = 2) and quantification (n = 4) of BiP and CHOP protein levels in the plantaris of older (18 m) WT and MuRF1 KO mice following no treatment (Con, black) and FO for 7 (hatched) and 14 days (white). Data are expressed as a fold change relative to WT control (mean ± SEM). Statistical significance was set at P < 0.05 and determined using a two-way ANOVA for growth and a one-way ANOVA for protein expression. * indicates significant differences between groups identified by the brackets.