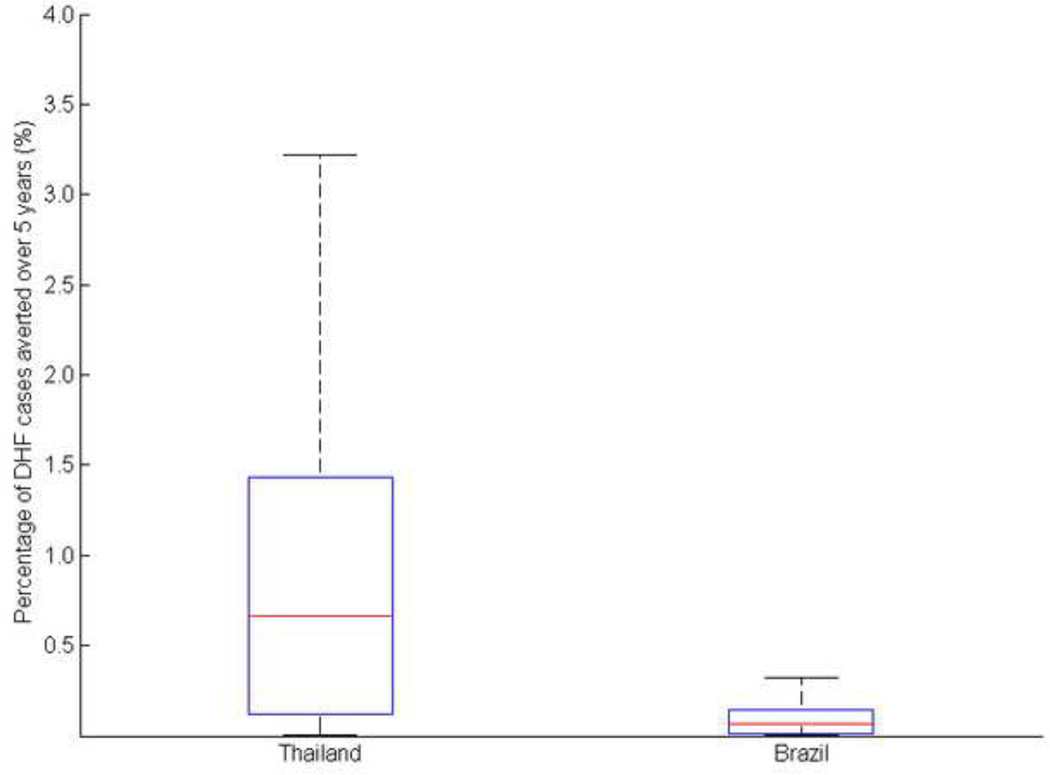
Figure 6. Comparison between the optimal age-targeted vaccination strategies derived from the base value with the optimal strategies obtained for different probabilities of mosquito-to-human transmission.
The red line represents the median, while the lower and upper bound of the boxplot represent the first and third quartiles.

