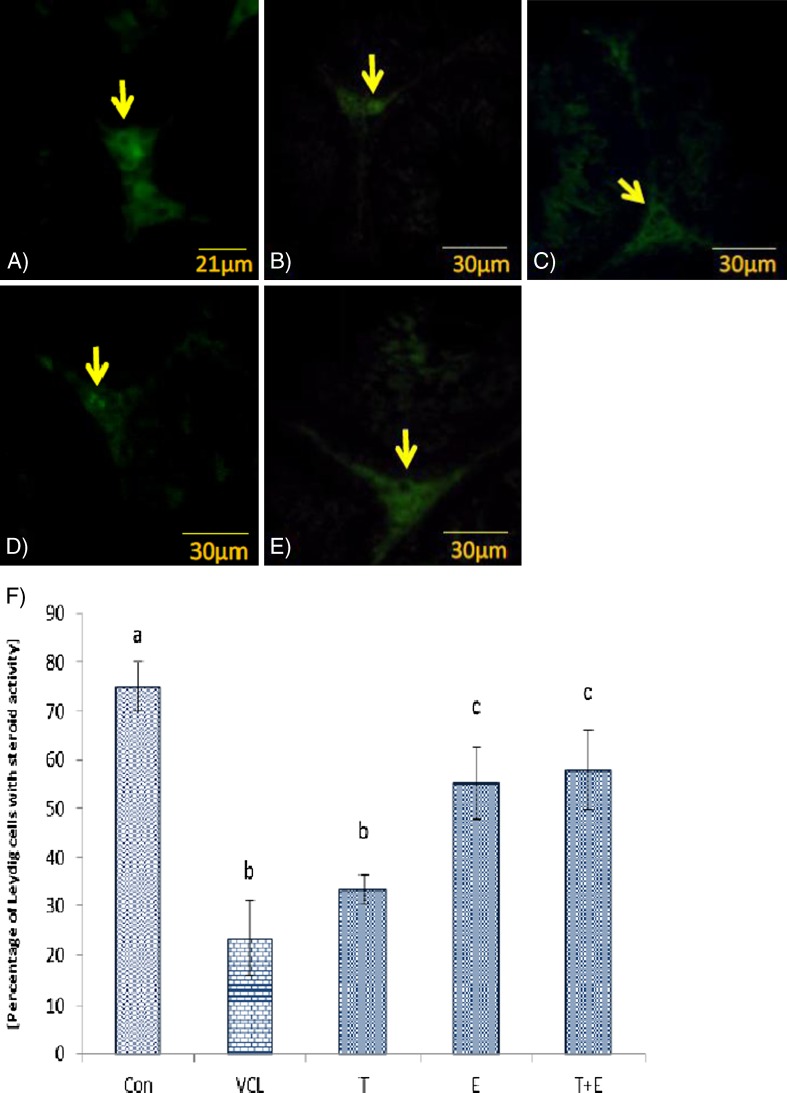
Fig. 5.
Fluorescent photomicrograph for steroid foci in Leydig cells; a Control-sham group, the Leydig cells are marked with intensive intacytoplasmic steroid (arrow), b Non-treated VCL group, c testosterone-received group, the Leydig cells are presented with faint reaction for steroid (arrows), d VitE-treated and e VityE + testosterone-administrated group, note the improved steroidogenesis in these groups. Fluorescent staining for Leydig cells steroid foci (×400). f Mean ± SD for percentage of Leydig cells with estroidogenesis per 1 mm2 of the interstitial connective tissue, a, b, c are indicating significant differences between control-sham group with non-treated VCL-induced group and between all treated groups with each other and with VCL-induced group (N = 6 rats for each group). P < 0.05 was considered as significantly different. Note; Con control-sham, VCL varicocele-induced, T testosterone-treated, E vitamin E-received, T + E testosterone + vitamin E-administrated

