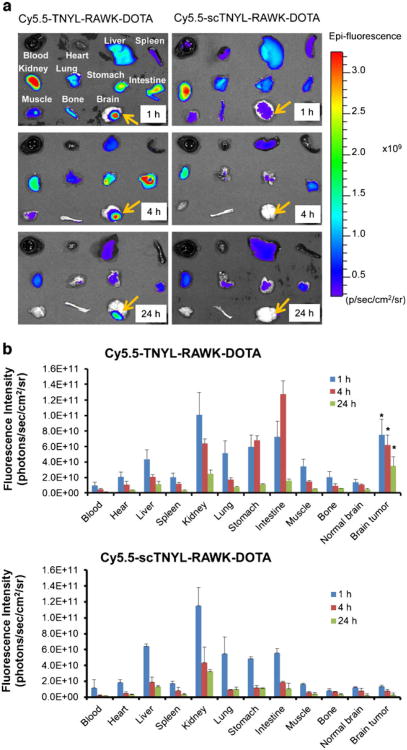
Fig. 5.
Biodistribution of Cy5.5-TNYL-RAWK-DOTA or Cy5.5-scTNYL-RAWK-DOTA peptides in nude mice bearing orthotopic U87-Luc tumors at 1, 4, and 24 h after intravenous injection of each imaging probe (n=4). a Representative near-infrared fluorescence optical images of various tissues obtained from the mice at the end of each imaging session. b Biodistribution after intravenous injection of Cy5.5-TNYL-RAWK-DOTA (top panel) or Cy5.5-scTNYL-RAWK-DOTA (lower panel) using the fluorescence intensity measurement method. Data are plotted as photon flux per second per square centimeter of tissue and are presented as mean ± standard deviation (n=3). Asterisk indicates significant difference in tumor uptakes between the two compounds at each time point.

