
Figure 3. ACP conformations and reorganization of its prosthetic group.
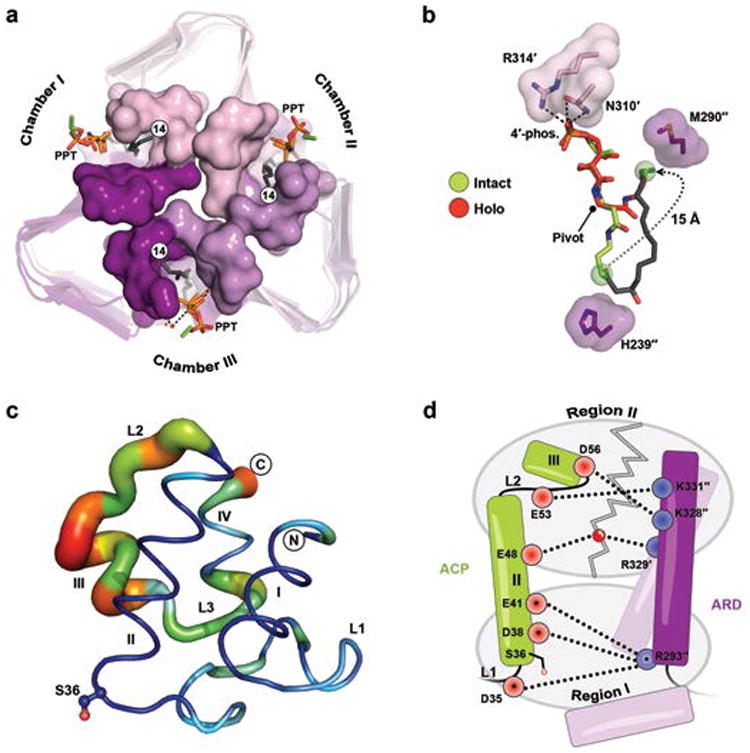
(a) Top-down view of LpxD (intact-acyl-ACP depicted) showing three reaction chambers enclosed by the 4′-PPT. (b) Structural comparison between the intact- (green) and holo-4′-PPT (red) prosthetic groups. The 4′-PPT rearrangement is indicated (gray dotted arrow). (c) Difference distance matrix calculated between fully modeled intact- (chain K) and holo-ACP (chain G). Deviations between like atoms are shown as a putty-sausage representation. Both the thickness and heatmap coloring indicate regions of least (thin, blue) to highest (thick, red) displacement. (d) Schematic summarizing differences in electrostatic interactions between ACP complexes. Residues are indicated as red (acidic) or blue (basic) circles and subdivided according to region I or II affiliation. Interactions made by intact-acyl-ACP alone are depicted (dashed lines) and those common among all complexes are represented with an asterisk. The gray zigzag indicates those electrostatic interactions that are broken in the hydrolyzed- and holo-ACP product complexes.