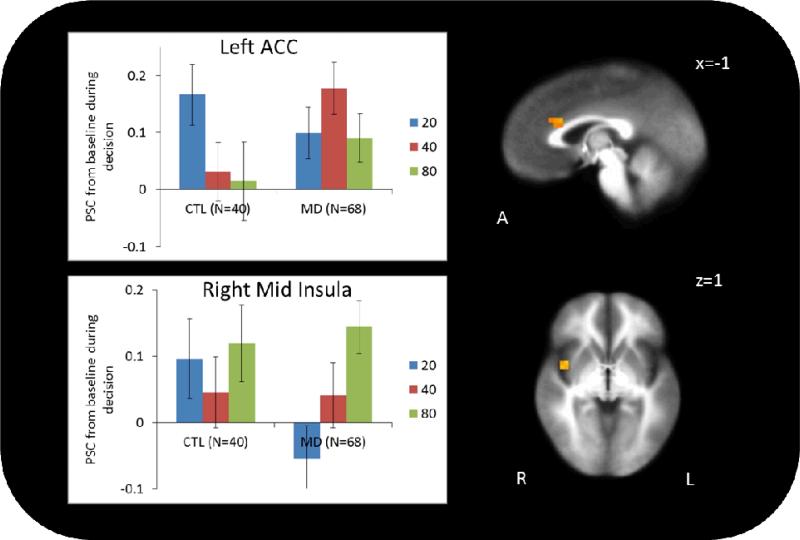
Figure 3.
Group by decision (risky versus safe) interaction. In the left dorsal ACC, CTL showed significantly less activation during risky relative to safe decisions. This is consistent with prior evidence in healthy volunteers that ACC activation is greatest during risk-aversion. MD showed no difference in activation between safe and risky decisions. In the right mid insula, CTL did not have different activation between safe and risky decisions, but MD showed significantly more activation during risky relative to safe decisions, with the highest activation during 80-point decisions. Error bars represent standard error from the mean.

