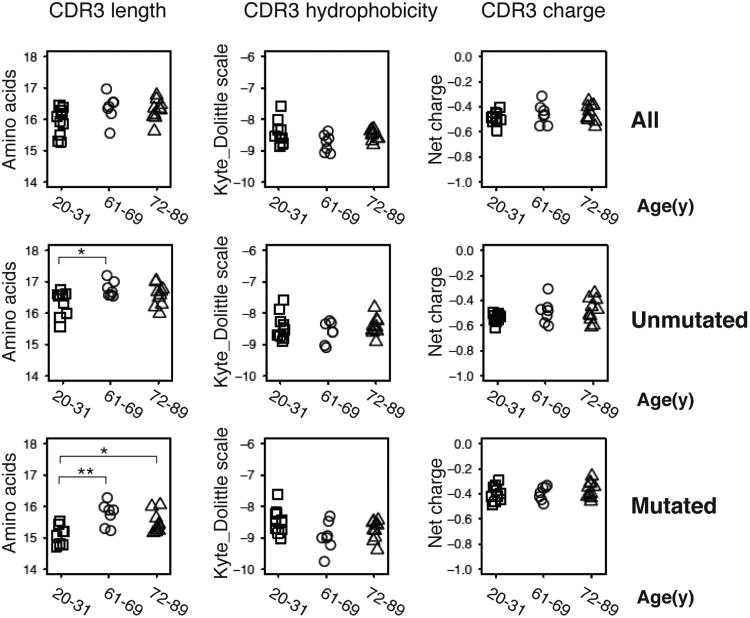
Figure 2. Increased IGH CDR3 lengths in older individuals.
Average CDR3 length, hydrophobicity, and net charge of unmutated sequences (middle panel) and mutated sequences (lower panel) of each sample are grouped by age. Sequences are pooled from two time points Y2 and Y3. Pairwise comparison was performed with two-sided student t-test. * P < 0.05, ** P<0.01. For unmutated sequence CDR3 lengths (in amino acids), age 20-31 mean = 16.3, SE = 0.1; age 61-69 mean = 16.8, SE = 0.1; p-value = 0.013. For mutated sequence CDR3 lengths, age 20-31 mean = 15.1, SE = 0.1; age 61-69 mean = 15.8, SE = 0.1; age 72-89 mean = 15.5, SE = 0.1; p-value for age 20-31 vs. age 61-69 = 0.003; p-value for age 20-31 vs. age 72-89 = 0.022.

