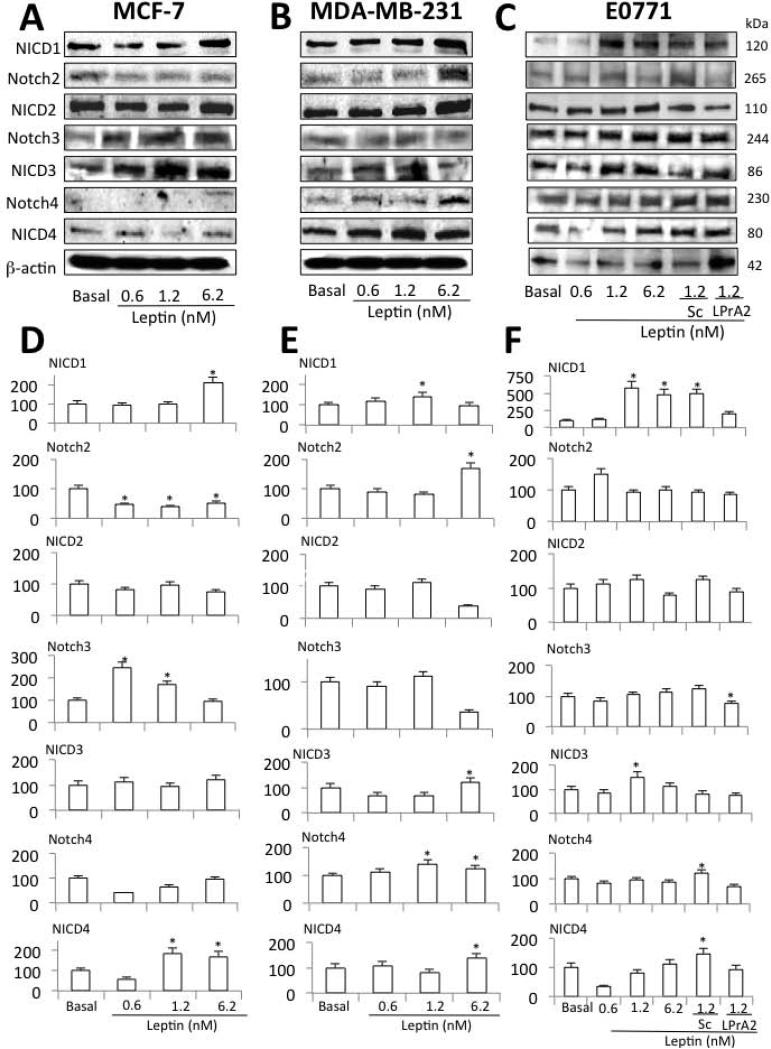
Fig 1. Leptin induces Notch in human and mouse breast cancer cells.
Representative Western blot (WB) results and quantitative analysis of leptin-induced effects on Notch 1, 2, 3 and 4 in human MCF-7 (A, D) and MDA-MB231 (B, E) and mouse E0771 (C, F) breast cancer cells. Cells were cultured for 24 h and leptin dose-induced (0, 0.6, 1.2 and 6.2 nM) effects were determined as described (see M &M). E0771 cells were also co-incubated with leptin and leptin inhibitor (leptin receptor antagonist 2, LPrA2) and inert control (scrambled peptide, Sc). The WB results were normalized to β-actin as loading control and densitometric analysis of bands for leptin-induced NICD1; Notch2; NICD2; Notch3; NICD3; Notch4 and NICD4 was carried-out with the image J software. (*) P<0.05 when comparing levels of protein to control (basal). Data (mean ± standard error) representative results derived from a minimum of 3 independent experiments.

