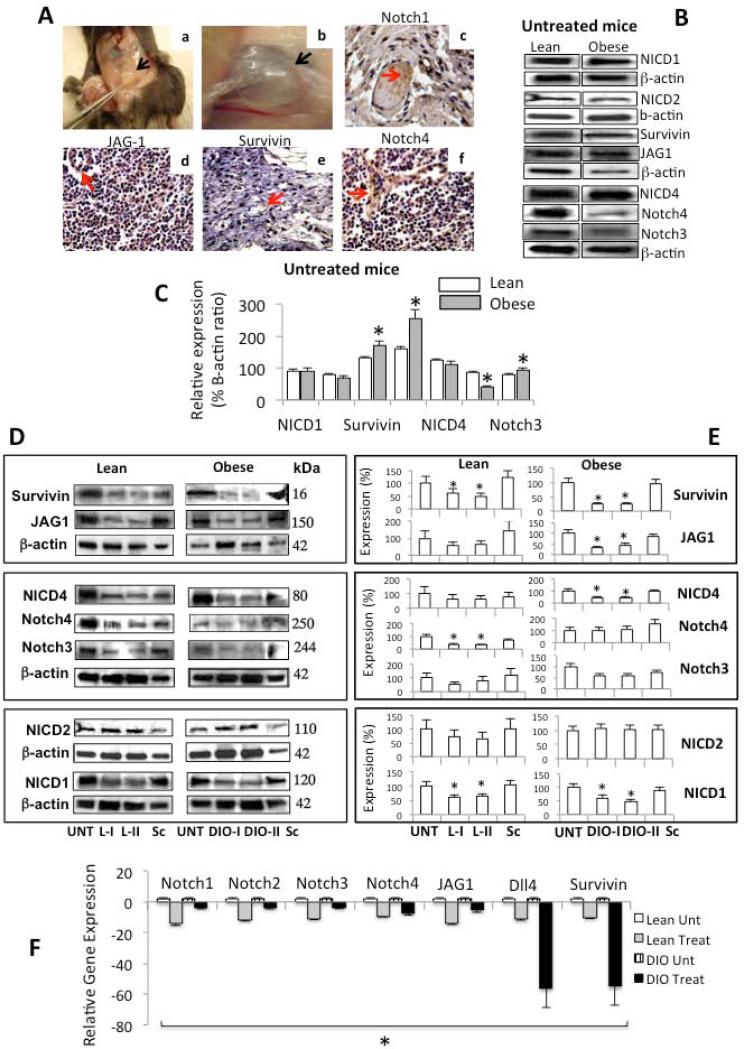
Fig 5. Effects of obesity on Notch expression in E0771-derived breast cancer.
Representative pictures from the immunohistochemical determination of Notch in E0771-derived breast cancer (A). Dissection on an E0771-derived breast cancer; black arrow indicates the tumor burden (Aa). Enhanced view of an E0771-derived breast cancer; (Ab). Notch1 (Ac); JAG-1 (Ad); survivin (Ae) and Notch4 (Af). Representative results from Western blot (WB) analysis of NICD1, NICD2, survivin, JAG, Notch4, NICD4 and Notch3 in E0771-derived breast cancer hosted by untreated lean and obese mice (diet-induced-obesity, DIO) (B). Quantitative analysis of WB results expressed as percentage of levels of Notch in untreated mice (C). Representative results from WB analysis of Notch proteins in E0771-derived breast cancer hosted by lean (L) and obese (diet-induced-obesity, DIO) mice untreated and treated with PEGLPrA2 (D). Quantitative analysis of WB results expressed as percentage of levels of Notch in treated mice (E). Quantitative analysis of Notch mRNA expression (receptors Notch1-4; ligands JAG1 and Dll4 and; targeted gene survivin) as determined by real-time RT-PCR (F). The WB results were normalized to β-actin as loading control and densitometric analysis of bands was carried-out with the image J software. mRNA levels were normalized to GAPDH. At week 6, lean and DIO-mice were allocated to 4 subgroups each and were untreated (Unt), received inactive peptide (Sc) or received PEG-LPrA2 treatment [once (L-I and DIO-I) or two times (L-II and DIO-II) a week for 3 weeks]. (*) P<0.05 when comparing levels of Notch and survivin in breast cancer tissue from untreated lean and DIO-mice and when comparing levels of protein or mRNA in treated mice to control (Unt). Data (mean ± standard error) representative results derived from a minimum of 3 independent experiments. Black and red arrows show the tumor mass and positive staining, respectively. Magnification ×40. PEG-LPrA2: pegylated leptin receptor antagonist 2.

