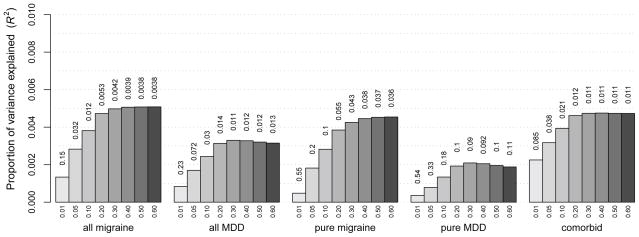
Fig. 2.
Averaged results of predictions based on 1000 permutations in the ATM data, in each of which a random sample of 805 individuals was removed from the dataset. Compared to the original analysis based on all ATM participants (Fig. 1b), this figure shows a small and consistent reduction in R2 which is independent of the phenotype. However, in the analysis excluding the 805 MDD cases (Fig. 1c), the reduction is very limited for pure migraine, but larger for the other phenotypes (which all include some cases with MDD). This indicates that the different results in ATM before and after removal of the MDD cases are indeed explained by MDD and not merely by differences in sample size

