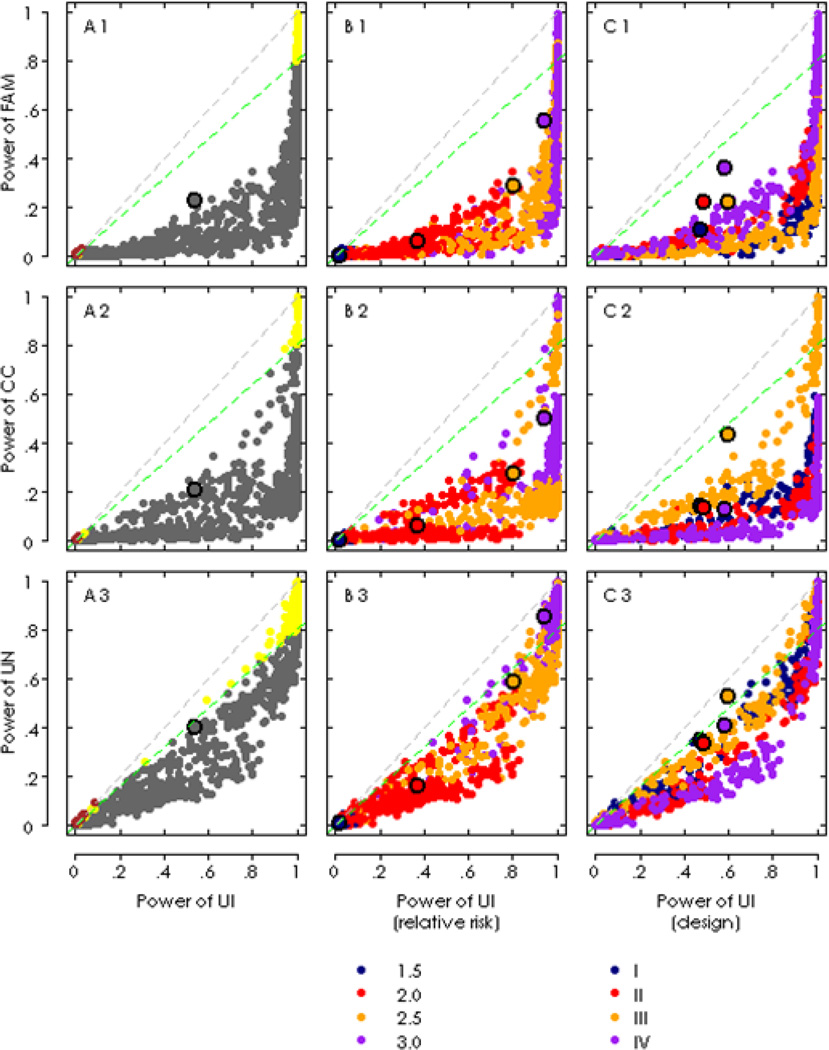
Figure 1.
Power comparison between the unified method and three reference methods given alpha=0.05. A The overall comparison of the power values. The gray points below the blue lines indicate the power values in their respective reference methods were less than 80% as much as the UI method, yellow points (yellow) larger than 80% but less than UI, the brown points greater than UI. The means of power were indicated with black circle, filled with gray, the horizontal value. B Comparison of the power with regard to the levels of relative risk. The means of power were indicated by the black circles, filled with their respective color of the level which they referred to. C Comparison of the power with regard to the study design. The means were represented the same as the panel B.

