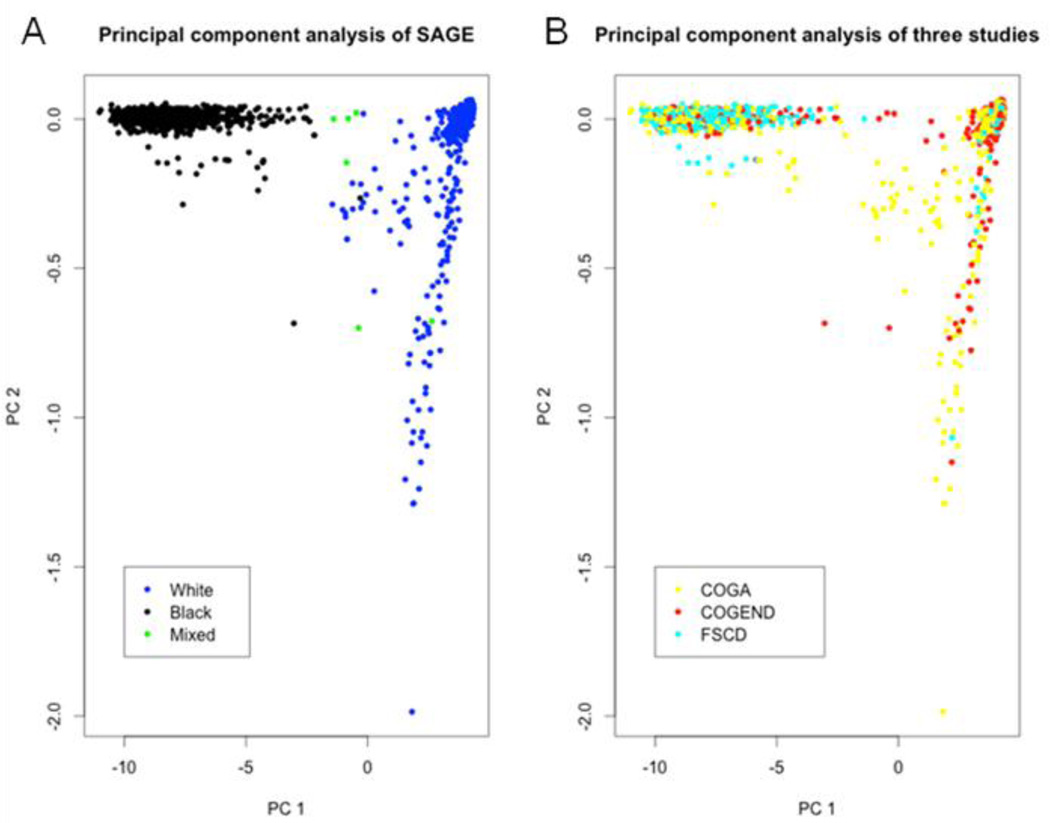
Figure 2.
The principal components analysis for SAGE. As there were relatives in the SAGE sample, two-stage method, as described in our method, was used for building principal components. A) the genetic background of the SAGE sample were plotted into the first and the second PC axes. B) the genetic background for the three sub samples in SAGE in the first and the second PC spaces.

