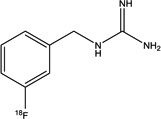
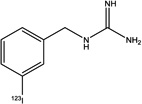
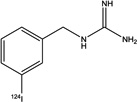
Table 2.
Specific activity estimates, logD, IC50, and serum protein binding data, and doses used for various studies.
| [18F]MFBG | [18F]PFBG | 123I-MIBG | [124I]MIBG | |
|---|---|---|---|---|
| Structure |

|

|

|

|
| Specific activity (GBq/µmol) | 18.7±1.1 (n = 3) | >18 | ~0.31 | > 12 |
| LogD (1-Octanol/PBS) | −0.52±0.01 (n = 2) | −0.48±0.01 (n = 2) | 0.42±0.01 (n = 3) | |
| IC50(µM) | 4.9±0.6 (n = 4) | 9.8±2.5 (n = 2) | 1.7±0.6 (n = 4) | |
| % unbound to human serum protein | 69.5±3.3 (n = 2) | NT | 12.4±0.5 (n = 2) | |
| % unbound to mouse serum protein | 66.9±1.1 (n = 2) | NT | 29.2±2.0 (n = 2) | |
| Dose for in vitro cell uptake (kBq/well) | 11.1 | 11.1 | 3.7 | 3.7 |
| Dose for in vivo image (MBq/mouse) | 5.5±1.8 (n = 7) | 7.4±1.8 (n = 5) | NT | 5.1 (n = 5) |
| Dose for biodistribution (MBq/mouse) | 5.9 | NT | 2.8 | 5.1 |
The number of independent studies is given in parentheses; with triplicates in each experiment. NT, not tested.
