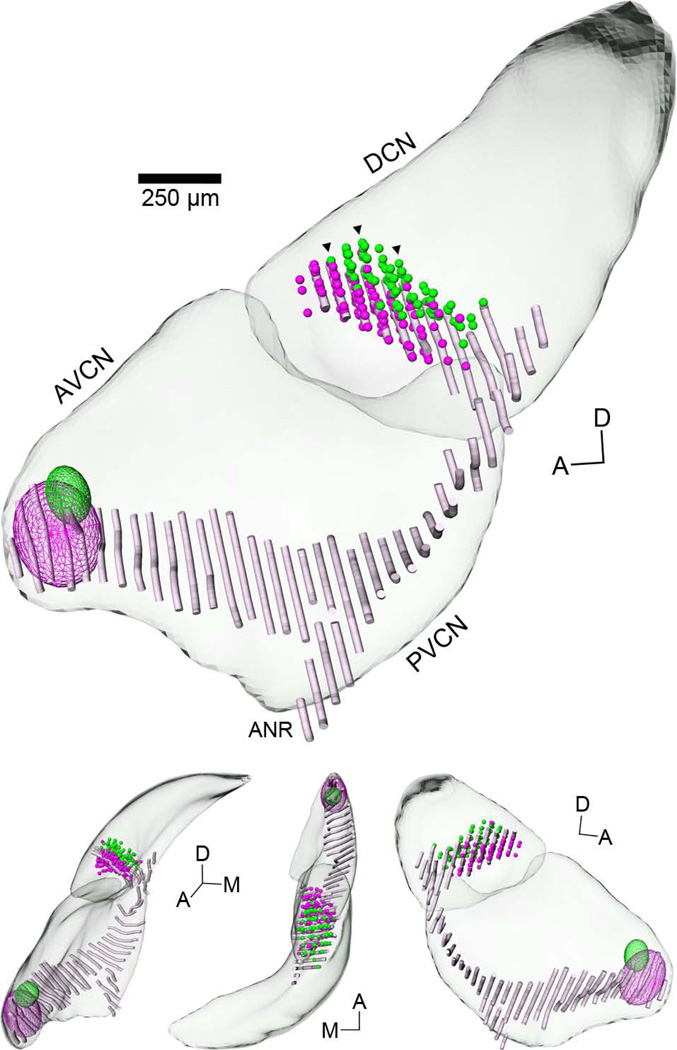
Figure 4.
3D reconstruction of cochlear nucleus illustrating locations of labeled vertical cells and AN fibers. Labeled data from all sections belonging to the case shown in Figures 1 and 3 (#38, Table 1) were normalized to a 3D template of the CN. Small spheres were used to indicate the positions of vertical cells in the DCN labeled by rhodamine (magenta) or fluorescein (green) injections in the AVCN. Wireframe ellipsoids were used to approximate the locations of each injection shown in Figure 1. Black triangles indicate the position of sections shown in Figure 3. Pale magenta “noodles” represent the 3D trajectory of AN fibers labeled by the rhodamine injection (data taken from Muniak et al., 2013). A systematic relationship can be seen between the relative locations of injection sites, projection patterns of AN fibers, and vertical cells. The top figure is from a medial viewpoint. Lower figures are from alternate viewing angles; L-R: anterior, dorsal, and lateral. Abbreviations: A, anterior; ANR, auditory nerve root; D, dorsal; M, medial. Scale bar = 250 µm for large figure only.

