Figure 5.
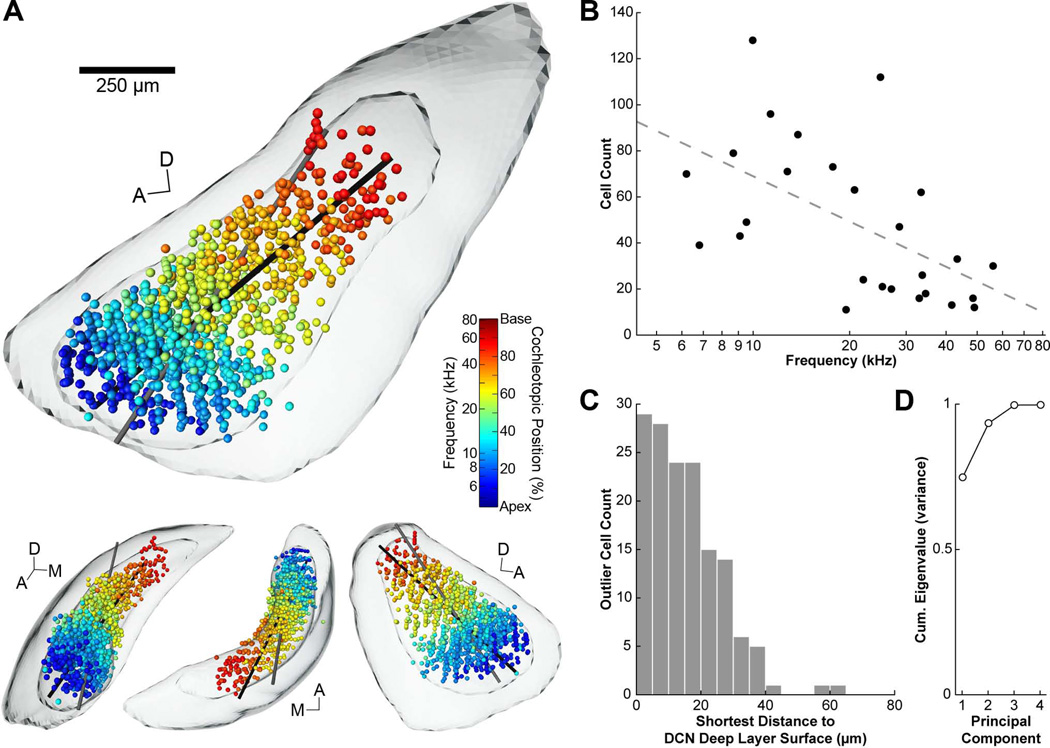
3D tonotopic arrangement of vertical cells in the DCN. A: The normalized locations of all vertical cells in the dataset are shown within the 3D model DCN. Each cell/sphere is shaded according to the BF of its paired injection site. Equivalent cochleotopic values are provided based on our frequency map (Muniak et al., 2013). Vertical cells are restricted to the confines of the deep layers (smaller surface within DCN surface) and are spatially organized with respect to BF. Black line represents the axis of the first principal component (see text). Grey line represents the axis of the multiple regression function. Both lines pass through the center of mass of the dataset. The top figure is from a medial viewpoint. Lower figures are from alternate viewing angles; L-R: anterior, dorsal, and lateral. Abbreviations: A, anterior; D, dorsal; M, medial. Scale bar = 250 µm for large figure only. B: Plot of number of vertical cells labeled by each injection as a function of injection BF. Injections with lower BFs tended to produce greater numbers of vertical cells. A regression line was fit to the data (R2 = 0.32, P < 0.003). C: Histogram of shortest distances to the surface of the deep layer of the DCN for each labeled cell located outside the hull of this surface. Most cells were contained within the deep layer, and all but 3 of the outliers remained within 40 µm of the surface boundary. D: Plot of cumulative eigenvalues from principal component analysis performed on the dataset. The first principal component accounted for 75% of the variance in the distribution of labeled cells.

