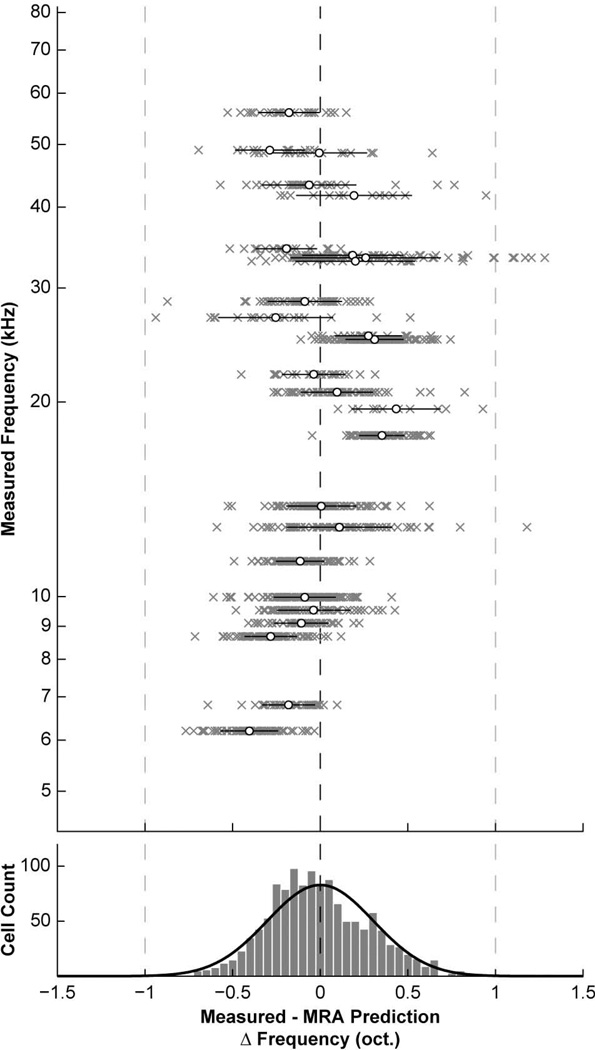
Figure 6.
Prediction errors for multiple regression analysis. Top: Plot comparing the measured BF for each vertical cell to its predicted value according to the MRA function (see text). The axes have been swapped, and differences are plotted in octave units as a function of measured BF. All points from a single injection are grouped along a horizontal line (grey x’s). Black bars and white dots indicate mean and SD for each group. While precise matches between predicted values and measured BFs were rare, extreme differences were scarce, and no systematic skew was observed, suggesting the MRA function is a reasonable characterization of vertical cell location with respect to frequency. Bottom: Histogram summarizing distribution of prediction errors. Taken as a whole, the majority of errors were confined to a one-octave range. A Gaussian function was fit to the distribution (0.00 ± 0.30 oct.).

