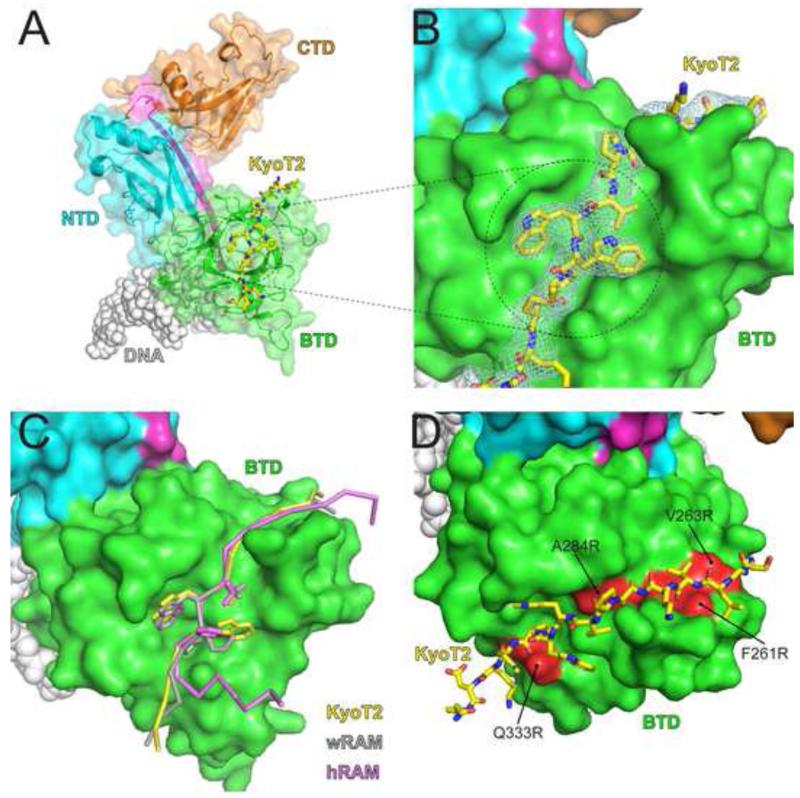
Figure 3. X-ray structure of CSL-KyoT2-DNA complex.
(A) Figure shows ribbon diagram of the CSL-KyoT2-DNA structure with transparent molecular surface. CSL is colored as in Figure 1. KyoT2, shown as a yellow stick representation (carbon, oxygen, and nitrogen atoms colored yellow, red, and blue, respectively) binds across the BTD of CSL. The DNA is represented as grey spheres. (B) Zoomed in view of the KyoT2 φWφP motif binding in the hydrophobic pocket of the BTD. KyoT2 electron density is shown and is derived from a simulated annealing composite omit map contoured at 1σ. (C) Structural overlay of KyoT2 with the RAM domains from the human Notch1 receptor (hRAM, pink) (Choi et al., 2012) and the C. elegans Notch receptor LIN-12 (wRAM, grey) (Friedmann et al., 2008). Corresponding cα atoms from KyoT2, wRAM, and hRAM were aligned and docked onto the BTD from the CSL-KyoT2-DNA complex structure. (D) Surface representation of the BTD showing where previously characterized mutations (colored red; F261R, V263R, A284R, Q333R) that affect RAM binding occur relative to KyoT2 binding (yellow, stick representation) (Yuan et al., 2012). See also Figure S2 for comparison of the two CSL-KyoT2-DNA complexes contained within the asymmetric unit.

