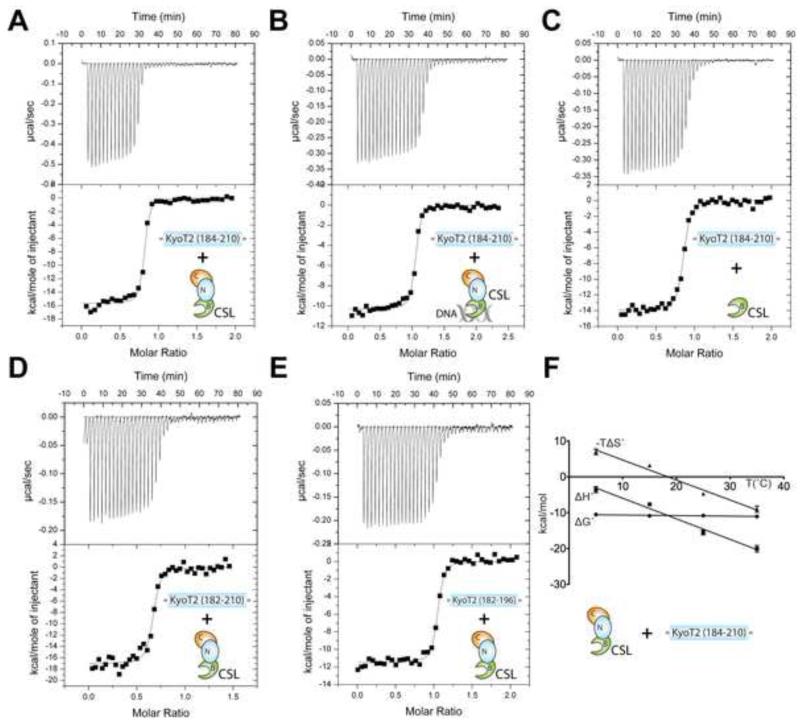
Figure 4. Thermodynamic analysis of CSL-KyoT2 binding interactions.
This figure shows representative thermograms (raw heat signal and nonlinear least squares fit to the integrated data) for KyoT2 binding to CSL. Forty titrations were performed per experiment, consisting of 7 μl injections that were spaced 120s apart. (A) Core CSL binding to KyoT2 residues 184-210. (B) Core CSL, pre-bound to a cognate DNA, binding to KyoT2 residues 184-210. (C) BTD binding to KyoT2 residues 184-210. (D) Core CSL binding to KyoT2 residues 182-210. (E) Core CSL binding to KyoT2 residues 182-196. (F) Thermodynamic profile of core CSL binding to KyoT2 residues 184-210. Thermodynamic parameters (ΔG°, ΔH°, and TΔS°) are plotted as a function of temperature (5, 15, 25, 35°C). The ΔCP of binding for the CSL-KyoT2 complex is −0.57 kcal/mol·K. See also Table S1 for buried surface at CSL-KyoT2 interface and Figure S3 for minimal KyoT2 peptide sequence that binds CSL.

