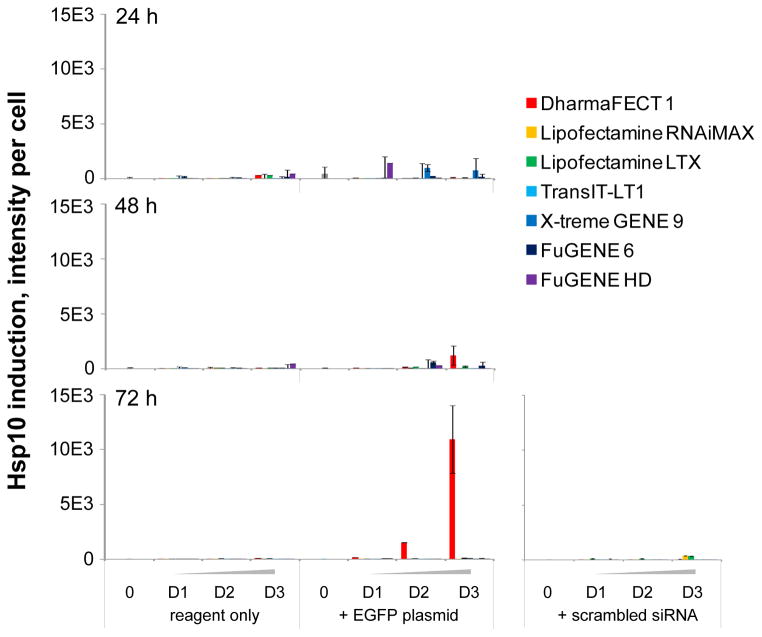
Figure 6. Hsp10 induction assessment in the presence or absence of seven transfection reagents.
Bar graph summary of the quantification of Hsp10 induction based on imaging and automated image analysis of Hoechst-stained nuclei and Hsp10 immunostaining as a function of time. Seven commercially available transfection reagents are tested at 3 dilutions D1, D2 and D3 corresponding respectively to 0.025, 0.05 and 0.1 μL per well compared to control wells in absence of transfection reagent. Hsp10 induction is measured at 24, 48 and 72 hours post transfection with chemical transfection reagent only and in combination with the EGFP DNA plasmid or scrambled siRNA duplex. Images on the Cy5 channel imaged at 40X objective magnification on the INCA6000 automated laser-based imaging platform with confocal modality showing Hsp10 expression.

