Figure 2.
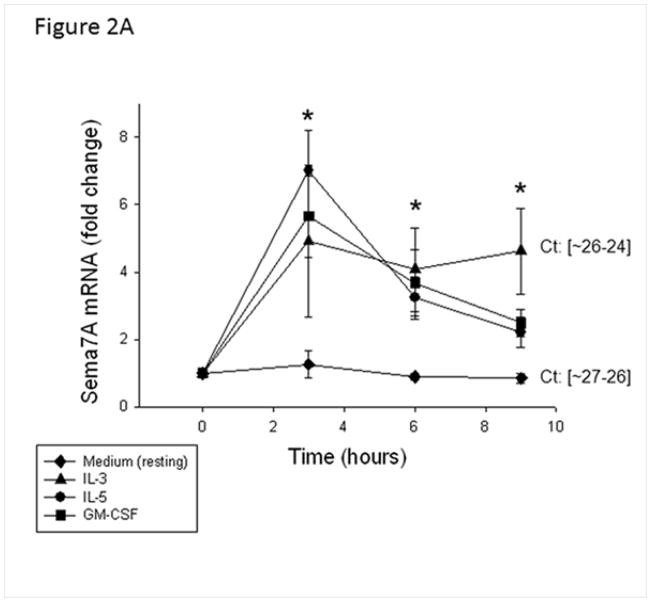
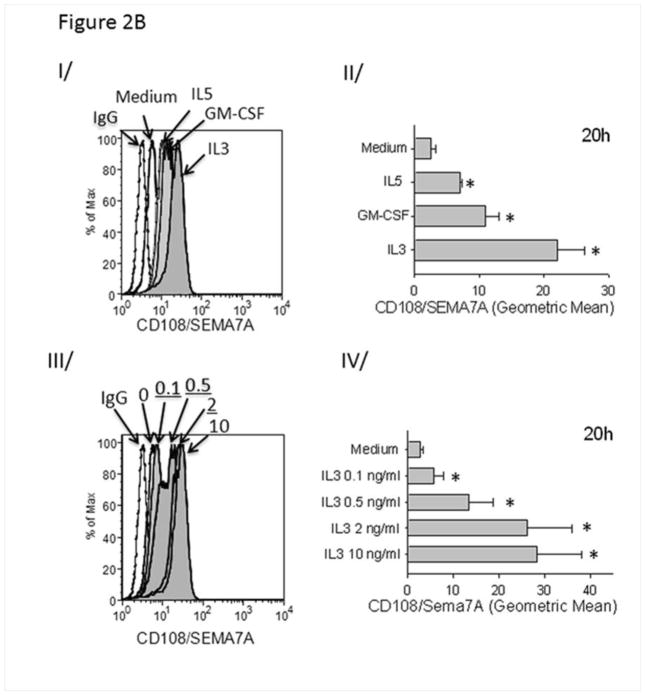
Effect of IL-5 family cytokines on sema7A in EOS. A/ EOS were activated with IL-5, GM-CSF, or IL-3 (2 ng/ml) for the indicated times. Data are calculated as mRNA fold changes compared to before culture (Time = 0) are shown and represent the average ± SD of EOS from 3 different donors. * indicates that all three cytokines induced greater levels of sema7A mRNA compared to medium alone (resting). The range of cycle thresholds (Ct) for sema7A obtained with resting or IL-3-activated EOS at 9 h is shown and indicates resting EOS expressed abundant amount of sema7A (similar Ct as for the housekeeping transcript, GUSB). B/ Sema7A (CD108) was analyzed by flow cytometry; geometric means were calculated by subtracting values for isotype control. I/ and II/ EOS were incubated for 20 h with IL-5, GM-CSF or IL-3 (2 ng/ml). A representative histogram for sema7A is shown in panel I with the mean ± SD for EOS from 3 different donors depicted in panel II. III/ and IV/ EOS were activated for 20 h with increasing doses of IL-3 from 0.1 to 10 ng/ml as indicated. A representative histogram is shown in panel III with the mean ± SD for EOS from 4 different donors depicted in panel IV. *p<0.05 compared to resting EOS.


