Figure 1.
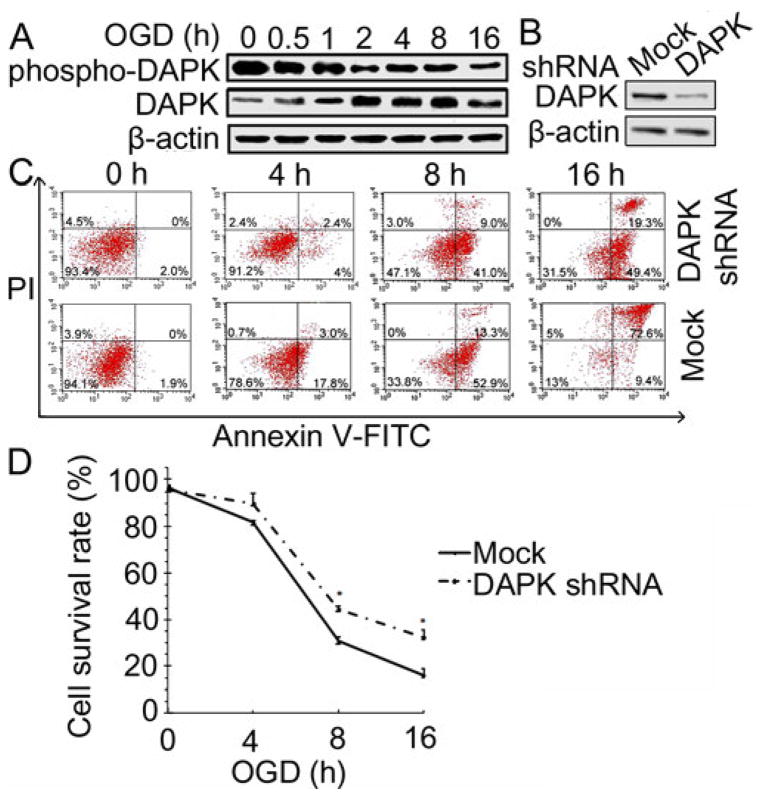
DAPK promoted neuronal death during OGD. (A) DAPK expressions during OGD. SH-SY5Y cells were exposed to OGD for the indicated time period, lysed and analyzed with Western blot. β-actin was used as a loading control in this and subsequent figures. (B) DAPK shRNA transfection inhibited DAPK expression. SH-SY5Y cells were transfected with lentiviral particles encoding copGFP (mock) or DAPK shRNA. DAPK protein level was analyzed by Western blot. (C) Annexin-V FITC/PI assay of cell survival after OGD treatment. DAPK shRNA or mock transfected cells were treated with OGD for the indicated hours. Cell death was detected with Annexin-V FITC and PI staining and analysed by flow cytometry. Dots in the lower right quadrant represent population of apoptotic cells and dots in the upper right quadrant represent population of late stage of apoptotic cells and necrotic cells. Results are representative of one of three independent experiments. (D) Pooled data of Annexin-V FITC/PI assay (n=3). The bars represent mean±SEM. * (p<0.05) compared with mock transfected cells.

