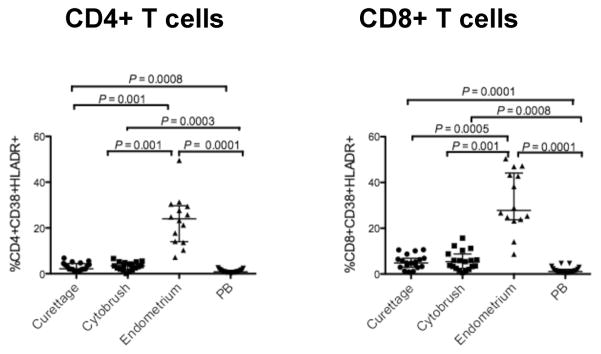
Figure 5. Endometrial CD4+ and CD8+ T cells are highly activated.

The figure shows the percentage of CD4+ (left, A) and CD8+ (right, B) T-cells expressing CD38 and HLA-DR from curettage, cytobrush, endometrium and PB. Horizontal lines correspond to median values; vertical lines and whiskers represent the 25th and 75th percentiles. For statistical analysis, two-tailed Mann-Whitney tests and Holms’ sequential Bonferroni corrections were performed.
