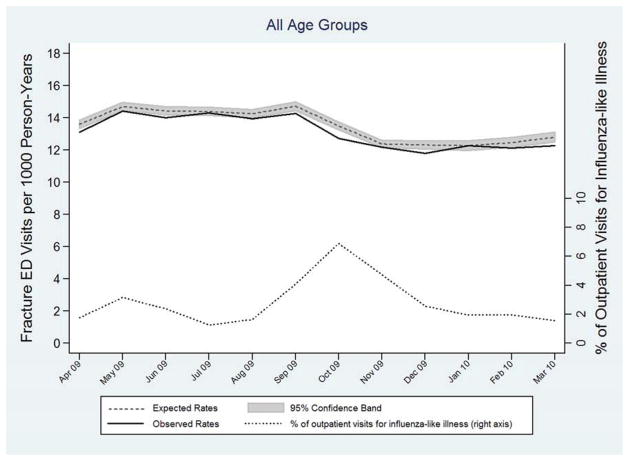
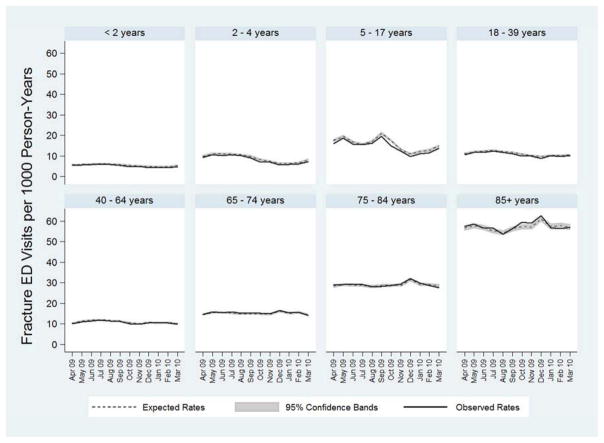
Figure 2.
Observed (solid line) and expected (dashed line with shaded 95% confidence interval) incidence rates of ED visits for fractures in the United States for all age groups combined (A), and stratified by age group (B), during the 2009 Influenza A (H1N1) pandemic period, April 2009 through March 2010. Influenza activity, measured by the percentage of outpatient visits for influenza-like illness (ILI) reported by the Centers for Disease Control and Prevention (CDC),24 is represented by the dotted line in (A). Area under the observed rates line and above the expected rates line represents excess ED visits for fractures.


