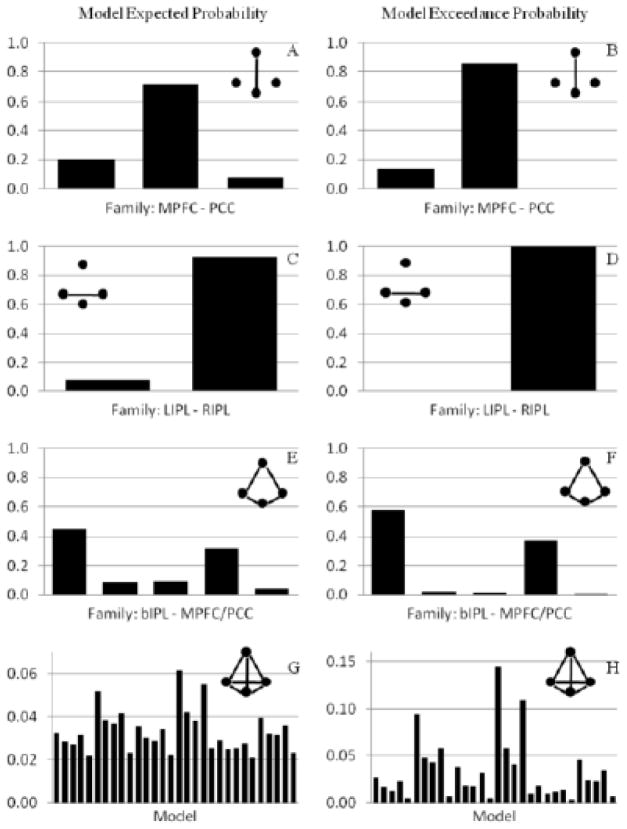
Figure 5.
Expected probability (left) and exceedance probability (right) for the DCM model families and individual models in the Bayesian model selection. Panel A) and B) show the results of model comparison for the MPFC-PCC families. Panel C) and D) show the results of model comparison for the LIPL-RIPL families. Panel E) and F) show the results of model comparison for the bIPL-MPFC/PCC families. And the panel G) and H) show the results of model comparison for all the 30 models.

