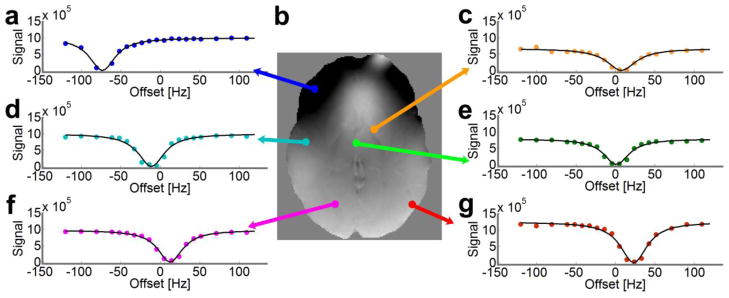
Figure 1.

Direct saturation Z-spectra in various voxels of an axial-oblique slice. (a, c–g) The direct saturation signal magnitude is plotted as a function of RF offset frequency with respect to the scanner reference frequency (ωref) at 0ppm. (b) The resonance frequency map (field map) is calculated from the minimum of the direct saturation spectra using Lorentzian lineshape fitting. The colored dots in Z-spectra denote the experimental data points, and the black lines denote the fitted lineshape.
