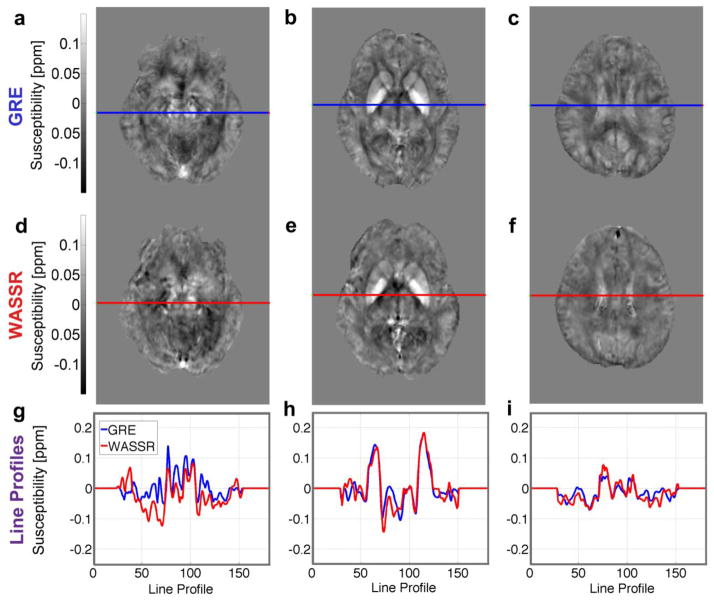
Figure 10.
Susceptibility maps from (a–c) multi-echo 3D GRE and (d–f) 3D WASSR calculated using the LSQR method (with a stopping relative residual set to 0.08) from one subject’s corrected frequency maps and coregistered to the Eve atlas. (g–i) Line profiles across these maps for GRE (blue lines) and WASSR (red lines) show similar trends for both methods in slices through (a, d, g) the red nucleus and substantia nigra, (b, e, h) basal ganglia, and (c, f, i) corticospinal tract.

