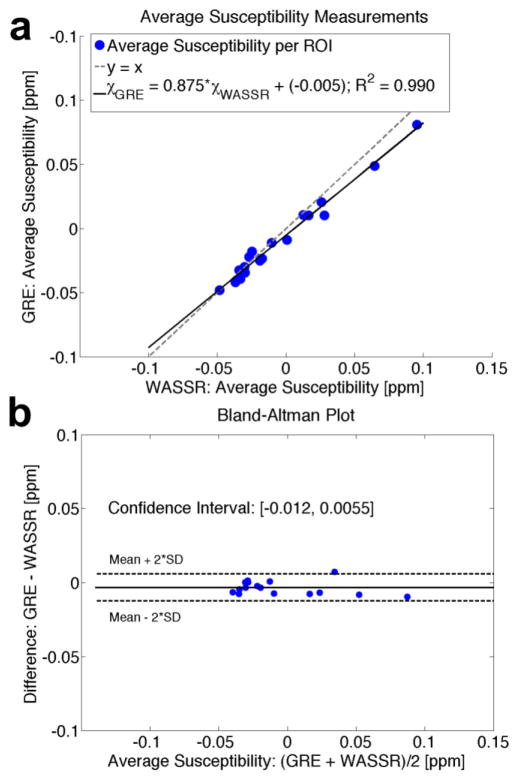
Figure 12.
Comparison between average susceptibilities in ROIs from Figure 11c measured by WASSR and multi-echo GRE. (a) Correlation between average susceptibility measurements. (b) Bland-Altman plot showing that the mean difference between GRE and WASSR is very small. The confidence interval is narrow and encompasses zero difference, which signifies a high correlation between the two methods.

