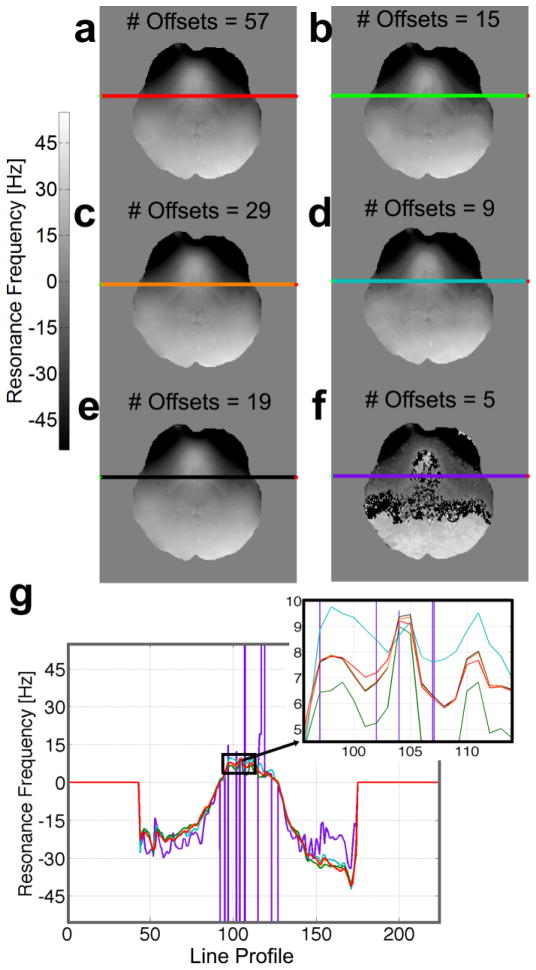
Figure 5.
Resonance frequency maps calculated using different RF sampling densities within the same sweepwidth. (a) A highly sampled dataset of 57 volumes with 5Hz spacing over a +/− 140Hz range. This dataset was used as “gold standard,” then discretely down-sampled, from (b) 29 points acquired every 10Hz to (f) five volumes acquired every 70Hz. Note that (e) was sampled non-linearly every 5Hz between +/−80Hz and 10Hz from +/− 80 to +/−120Hz. (g) The line profiles through the same slice of the calculated resonance frequency maps show comparable behavior for numbers of offsets ranging from 19 to 57 (see inset with sub-Hertz range).

