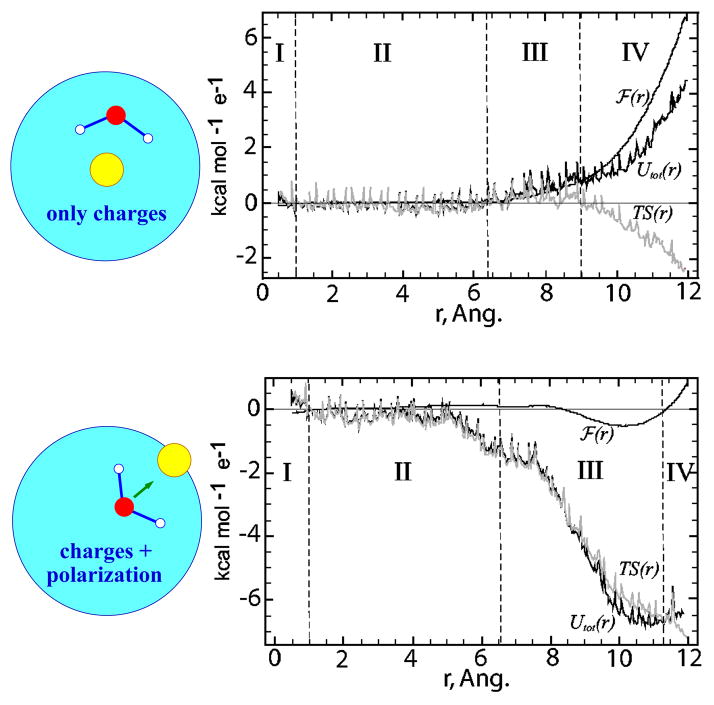
Figure 4.
Total free energy
 (r) (smooth dark line) and total potential energy Utot (r) (noisy dark line) for a Cl− ion in a spherical cluster of 238 waters as a function of the distance r of the ion from the center of the cluster. Top panel: SPC/E water model. Bottom panel: RPOL water model. The entropic T S(r) contribution (obtained simply as the difference between Utot (r) and
 (r)) is plotted just to show that this contribution is not negligible. Reprinted with permission from Ref. 285 Copyright 2005 American Institute of Physics.

