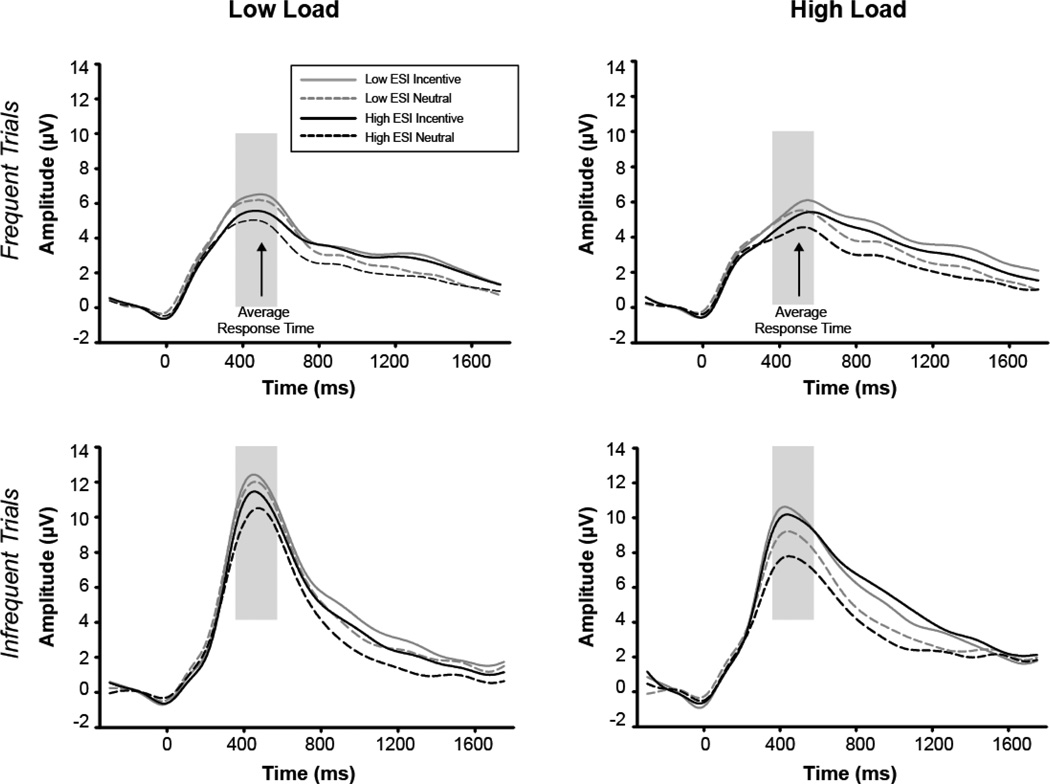
Figure 1.
Grand average ERP waveform at Pz for individuals low and high on ESI scores. Though the primary analyses were conducted using externalizing scores continuously, a median split was used here solely for depiction. ERP waveform for frequent (top) and infrequent (bottom) trials for low (left) and high (right) load conditions. Black lines represent high ESI group, grey lines represent low ESI group. Solid lines illustrate incentive conditions, dashed lines illustrate neutral condition. A digital low-pass filter was applied offline before plotting the waveforms. Gray box indicates P3 window used for analyses. Arrow indicates average response time (during frequent trials).

