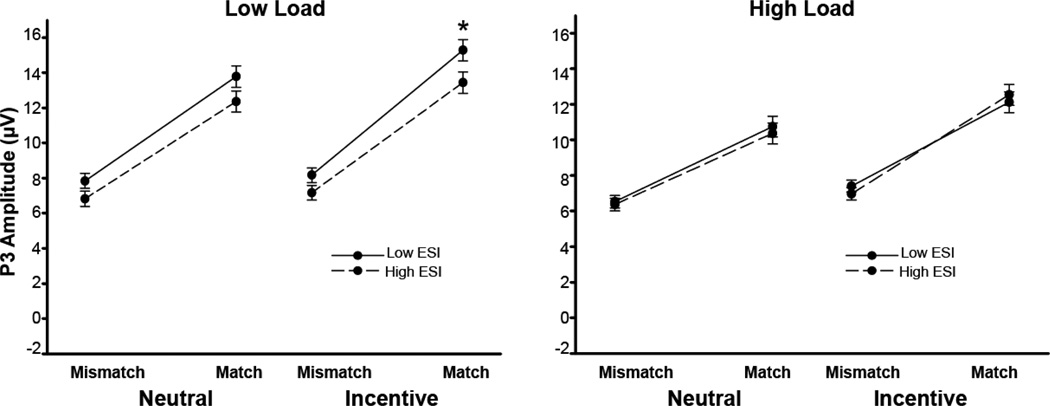
Figure 2.
Effect of ESI scores on P3 Amplitude. The relationship between ESI scores and P3 was associated with load, trial type and incentives (load × trial type × incentive × ESI interaction). Using point estimates generated from the general linear model, the P3 means for the interaction contrast in the frequent (mismatch) and infrequent (match) trials were calculated at 1.5 SD below and above the sample mean ESI total scores, respectively. Error bars represent the standard error for the point estimates. There was noESI-related difference for mismatch trials in low load, but there was a significant difference for the low load match trials, specifically in the incentive match trials (*p < .05). There were no significant ESI-related effects in the high load condition.

