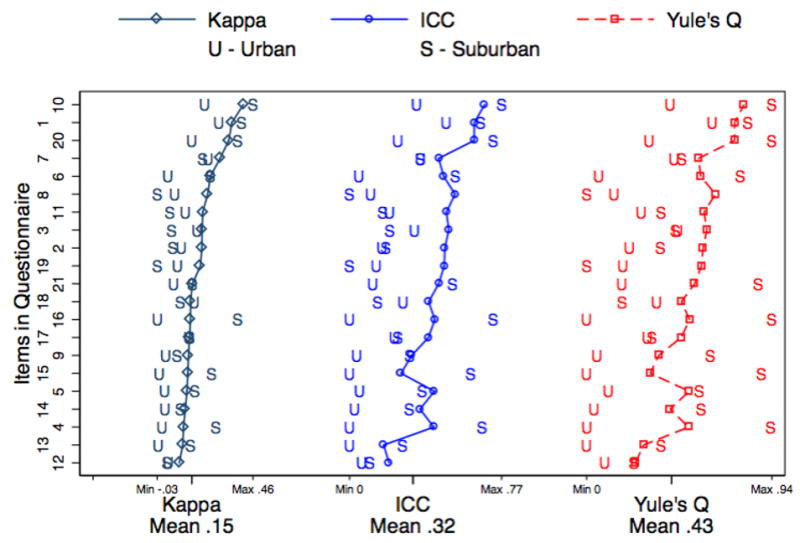
Figure 1.

Agreement between parent and youth, overall (connected lines) and in urban (labeled “U”) and suburban (labeled “S”) areas, measured by Kappa, intraclass correlation coefficient, and Yule's Q. Agreement is higher in suburban areas in general (U is to the left of S).
