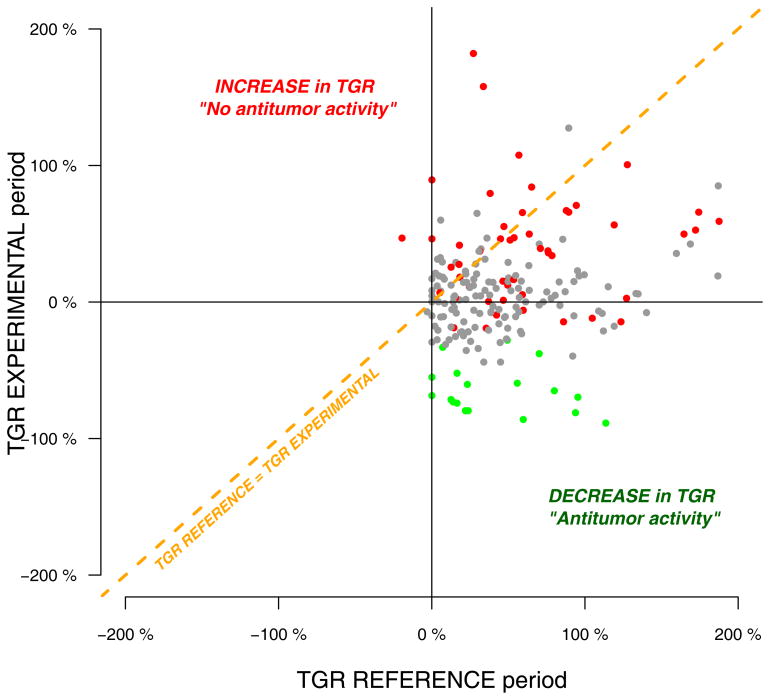
Figure 2.
Pairwise comparisons of TGR between the REFERENCE and THE EXPERIMENTAL periods in 201 patients treated in 20 phase I clinical trials (P values are computed from wilcoxon pairwise tests, n represent the number of samples with pairwise TGR information). Red, grey and green colors indicate progressive disease, stable disease and partial response as per RECIST criteria, respectively.

